


Gold Breakout or Fakeout? Gold and U.S. Dollar Analysis
Commodities / Gold & Silver 2009 Oct 16, 2009 - 02:18 PM GMT

 In one of the previous essays I’ve drawn Readers’ attention to the fact that gold has now decisively broken above the $1,000 level, and that this profound action has important implications for all gold and silver investors. I have received many e-mails from investors (for which I am thankful) and several of them asked about the price of gold in currencies other than gold. Therefore, this week I will provide you with analysis of gold with emphasis on its price in currencies other than U.S. Dollar.
Let’s begin with charts (courtesy of http://stockcharts.com) featuring gold in several key currencies along with the previously featured non-USD version.
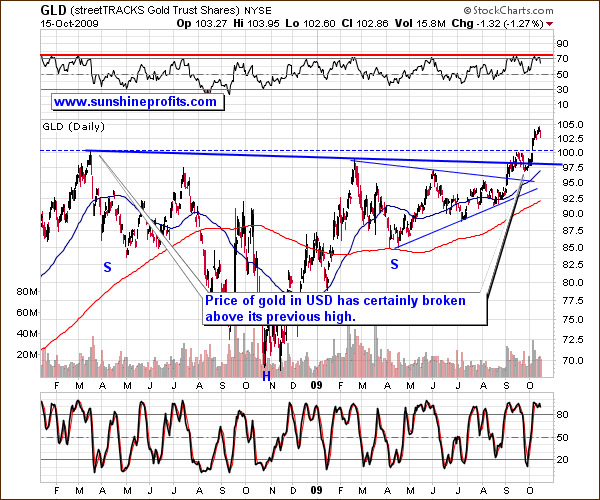
The breakout is clearly visible in the popular gold chart on which gold is priced in U.S. Dollars.
From the short-term point of view, taking the RSI into account, we may be at a local top or a few days before it (which is more likely, taking the previously mentioned targets into account). Please note that in mid-September the value of this indicator hovered around the 70 level for a few weeks before the top emerged.
The other indicator included in the above chart – the Stochastic indicator is one of the useful tools for timing bottoms in gold (its reliability for estimating local tops has been limited in the past), but since we are not near one, I will not analyze it deeply today.
Moving on to the non-USD (gold:UDN ratio) chart of gold we see that metal’s value is not yet above it’s previous highs. UDN is the symbol for PowerShares DB US Dollar Index Bearish Fund, which moves in the exact opposite direction to the USD Index. Since the USD Index is a weighted average of dollar's currency exchange rates with world's most important currencies, the gold: UDN ratio means the value of gold priced in "other currencies".
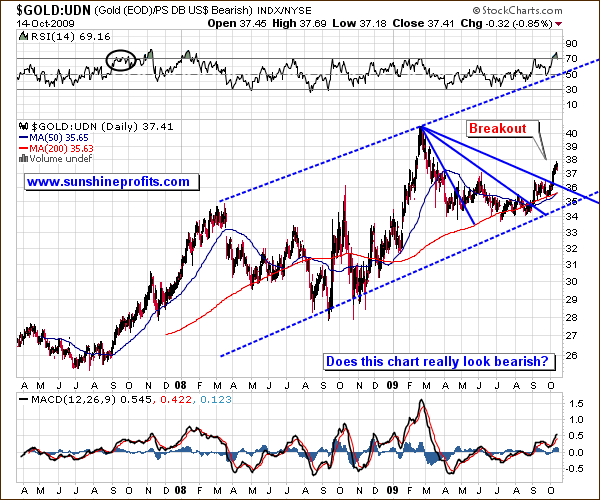
Gold didn’t break past its previous high in the recent months, but that is not the same high that one looks at when viewing the price of gold in the U.S. Dollar. The March 2008 high that was the top that gold broke above in USD, but taking other currencies into account – it has already broken this level in January. Consequently, the non-USD gold chart different from its USD counterpart but is just as bullish. After all, price broke higher almost a year earlier and has verified that breakout a few times over several months, which means that it is now set to rise higher, most likely above its 2009 high.
The Relative Strength Index is at the overbought level in the long-term perspective, but this does not concern me. The reason is that it is not the first time that it reaches the 70 level after a multi-month consolidation – please take a look at September 2007 and the way RSI shaped at that time – I’ve marked it with a black ellipse. It’s been overbought for about a month before a temporary (!) top emerged. Therefore, taking the historical context into account, the normally bearish implications of the RSI at 70 don’t really apply here.
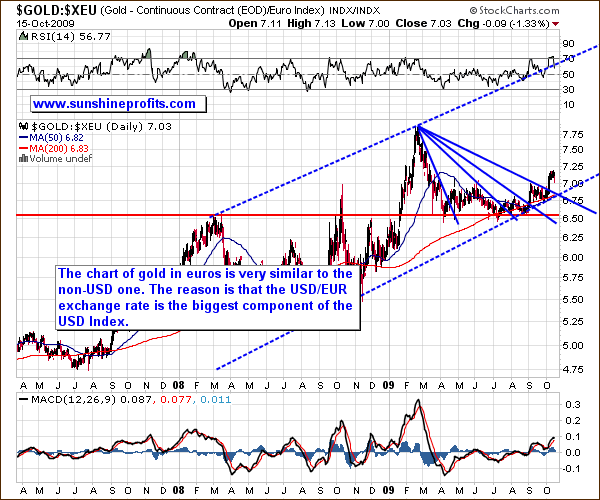
Two above charts are very similar and it is not without a reason. Since the biggest component of the USD Index is the USD/EUR exchange rate, the USD Index trades in a similar fashion to the USD/EUR exchange rate. Consequently UDN fund trades in the opposite direction to this currency rate, which causes the gold: UDN (non-USD gold) to trade in a very similar way to gold priced in Euros.
Since that is the case, the points made while commenting on the previous chart apply also to this chart. In short – it’s bullish for gold.
The second biggest component of the USD Index is dollar’s exchange rate with yen, so let’s take a look at price of gold in this currency.
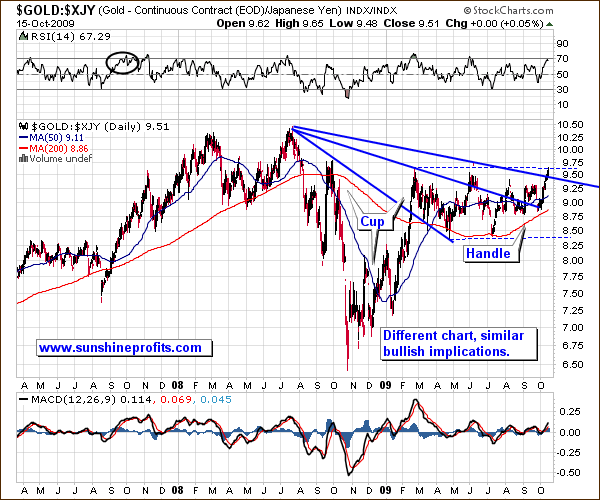
The value of gold in yen doesn’t have as clearly defined trend as it was the case on the previous charts, but it doesn’t mean that the implications of this chart are bearish. In fact, while we don’t see a rising trend channel, we do see another bullish pattern. The cup-and-handle pattern, whose handle has been forming since late February 2009 has the same bullish implications as the analogous pattern had on silver market – I wrote about it in April, when silver was at $12. Keeping in mind the “the longer the base, the stronger the move” rule, one might infer that the rally following breakout of the current handle will take the price of gold in yen much higher, probably above the previous highs.
The three declining resistance lines have been broken, thus increasing the odds of further gains. As far as the RSI’s overbought signal is concerned, the situation is once again similar to the one in September 2007 – the normally bearish implications don’t seem to apply to this ratio. The full version of this essay includes analysis of gold priced in other currencies including Canadian Dollar, British Pound, and Australian Dollar.
Moving on to the more recent price action, this week I will provide you with analysis of the precious metals stocks.
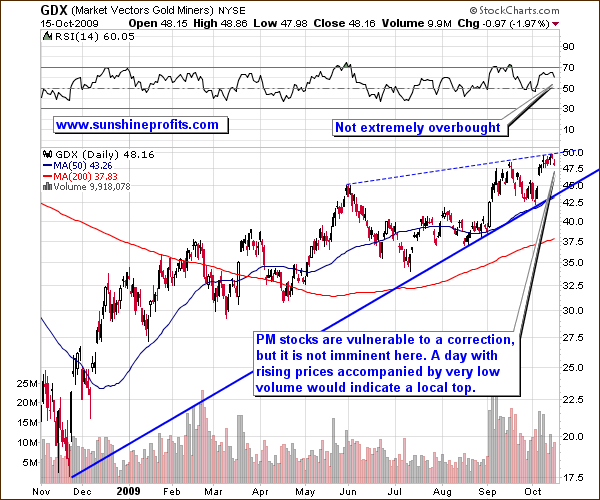
The very recent price action in the mining stocks has been less profound than it was the case with gold itself, but after a correction in the price of gold (during which $1,000 holds) I expect PM stocks to regain their strength.
As far as the short-term is concerned, the GDX ETF (proxy for precious metals stocks) touched its resistance line and dropped slightly. Still, the RSI is not overbought yet, and the volume is not extremely low, so the rally may take us above the dashed resistance line before taking a breather. This is confirmed also by the analysis of the Gold Miners Bullish Percent Index.
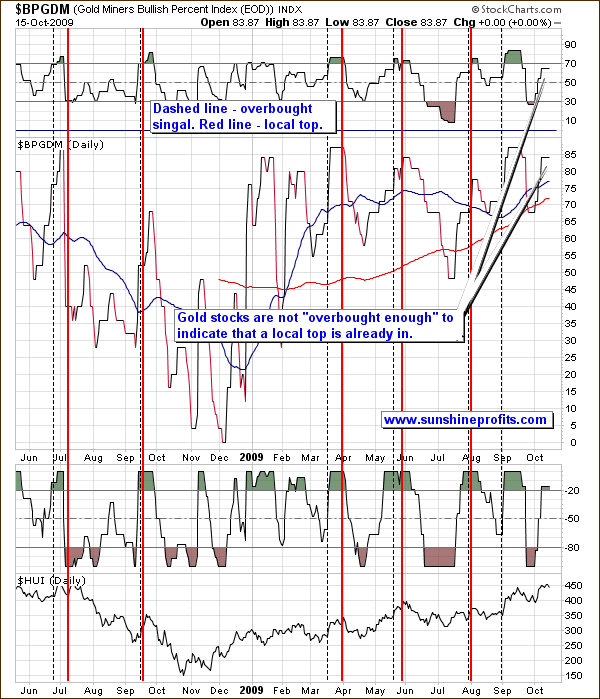
As you may see on the above chart, the highest odds that a local top is in are generated by high values of the index along with overbought levels in RSI and William’s %R indicators. Moreover, once RSI moves above the 70 level it is just a “watch out” signal, it is not yet a confirmation of a top. The top usually takes place several days/weeks after the initial signal is flashed (see vertical dashed and red lines on the chart above for details). Either way, according to the above analysis, we are not at the “sell now” point yet.
Of course, this does not mean that a local top can’t form here, as speculation on timing (especially in the short term) is a game of probabilities – it is impossible to tell what is going to take place with 100% certainty; we can only estimate what is likely (!).
Summing up, the precious metals market bull market is healthy, virtually regardless of the currency that one decides to price gold/silver in. Naturally, the chart will look differently from the one including gold/silver priced in U.S. Dollars, but if you take the long term into account, it is clear that since 2006 gold has been rising not only in USD (which also marked the beginning of the second stage of the bull market in PMs). Consequently, the long-term situation remains bullish not only in the U.S. Dollar.
The situation on the general stock market is mixed, while the USD Index is verifying its recent breakdown. Should the value of the dollar move trade sideways, it is likely that PMs would move higher and then correct their recent gains. For now, it is probable (!) that the local top in metals / corresponding indices is not yet in, but we are close to it.
The full version of this essay includes charts of gold also other key currencies including CAD, AUD, and GBP, comments on the recent increase of the main interest rate by the Reserve Bank of Australia (what if it happens in the US? Is this likely?), and much more detailed analysis of the situation on the PM market along with the key driving markets. Moreover, I cover the situation in the juniors sector (one of my picks is up 90% since I featured it 2 weeks ago).
To make sure that you get immediate access to my thoughts on the market, including information not available publicly, I urge you to sign up for my free e-mail list. Sign up and you'll also get free, 7-day access to the Premium Sections on my website, including valuable tools and charts dedicated to serious PM Investors and Speculators. It's free and you may unsubscribe at any time.
Thank you for reading. Have a great and profitable week!
P. Radomski
Editor
Sunshine Profits
Interested in increasing your profits in the PM sector? Want to know which stocks to buy? Would you like to improve your risk/reward ratio?
Sunshine Profits provides professional support for precious metals Investors and Traders.
Apart from weekly Premium Updates and quick Market Alerts, members of the Sunshine Profits’ Premium Service gain access to Charts, Tools and Key Principles sections. Click the following link to find out how many benefits this means to you. Naturally, you may browse the sample version and easily sing-up for a free trial to see if the Premium Service meets your expectations.
All essays, research and information found above represent analyses and opinions of Mr. Radomski and Sunshine Profits' associates only. As such, it may prove wrong and be a subject to change without notice. Opinions and analyses were based on data available to authors of respective essays at the time of writing. Although the information provided above is based on careful research and sources that are believed to be accurate, Mr. Radomski and his associates do not guarantee the accuracy or thoroughness of the data or information reported. The opinions published above belong to Mr. Radomski or respective associates and are neither an offer nor a recommendation to purchase or sell securities. Mr. Radomski is not a Registered Securities Advisor. Mr. Radomski does not recommend services, products, business or investment in any company mentioned in any of his essays or reports. Materials published above have been prepared for your private use and their sole purpose is to educate readers about various investments.
By reading Mr. Radomski's essays or reports you fully agree that he will not be held responsible or liable for any decisions you make regarding any information provided in these essays or reports. Investing, trading and speculation in any financial markets may involve high risk of loss. We strongly advise that you consult a certified investment advisor and we encourage you to do your own research before making any investment decision. Mr. Radomski, Sunshine Profits' employees and affiliates as well as members of their families may have a short or long position in any securities, including those mentioned in any of the reports or essays, and may make additional purchases and/or sales of those securities without notice.
Przemyslaw RadomskiArchive |
© 2005-2022 http://www.MarketOracle.co.uk - The Market Oracle is a FREE Daily Financial Markets Analysis & Forecasting online publication.