


Gold New High Breakout Signals Short-term Topping Action
Commodities / Gold & Silver 2009 Oct 18, 2009 - 02:54 PM GMTBy: Merv_Burak

 The market action is signaling a short term topping activity but not yet one of a longer term nature. The next few days or weeks may give us a better clue as to the longer term direction for gold.
INTO NEW ALL TIME HIGHS
A move by a security or Index into new all time highs very often signals the start of a new major thrust to the up side. Most speculators/traders look for those moves into new all time high territory. If they think that the move has real strength they jump on it, after the break, getting in early on a new major move. They do not wait for days or weeks thinking if they should or should not get in on the action. The all (not) knowing media is quick to broadcast this move into new all time high territory creating more speculative interest. However, there is often a group of highly financed market operatives who know or are willing to bet the opposite. They can move the price through a strong resistance level, into new highs, and then sell, sell, sell (or short sell) as the speculator/traders are buying. These operatives (they may be rich individuals, corporations or even government entities) are not in it to lose their shirts, and seem to have a better insight into the possible trend ahead than do the speculators.
After a resistance break into new all time highs a security price should shoot up at least 20% before it takes a rest and then continues on its bullish way. This would be the action if the break had real strength and the sell operatives were therefore not in the game. If that rest comes only a few percentage points above the break one must start to suspect that in fact these operatives are in the market and their selling is holding back the price.
So, what do we have with gold, now that it’s broken into new all time highs?
Except for the day of the break-out (06 Oct 2009) the market action since has been pretty dull. Although the price did go a little higher (with emphasis on the little) we seem to be into a short term topping activity, described in more detail in the SHORT TERM section below. This does not look like the actions of a market that is gung-ho bullish, at least not the actions of the major bullish market players. Although it is very early after the break one must be cautious at this point. The risk is just too high that we will not see higher prices for some time. If you are aching to get in, wait for the price of gold to once more start moving higher and jump in after it makes a new, new high. That will lessen the risk substantially. Otherwise, sit back, have a beer and relax. Opportunities will come again.
One minor correction. I mentioned above that these operatives are not in it to lose their shirts. Well, if the operative is actually a government entity they don’t really care if they lose their shirts in the speculation. It’s not their shirt anyway, it’s yours.
GOLD : LONG TERM
One way a technician judges if a move is strong or weak is by using a momentum indicator. Now there are many momentum indicators, some better and some worst. It may be just me but one problem I find with many technicians is in their attempt to determine longer term moves by the use of shorter term indicators. Short term indicators are good at assessing short term moves but that does not say that such a move will result in a long term trend. I like using a time period sensitive momentum indicator, sensitive for the time period under consideration. In these commentaries you see me using the Relative Strength Index (RSI). To assess the long term market implications I like a 150 day RSI or a 30 week version.
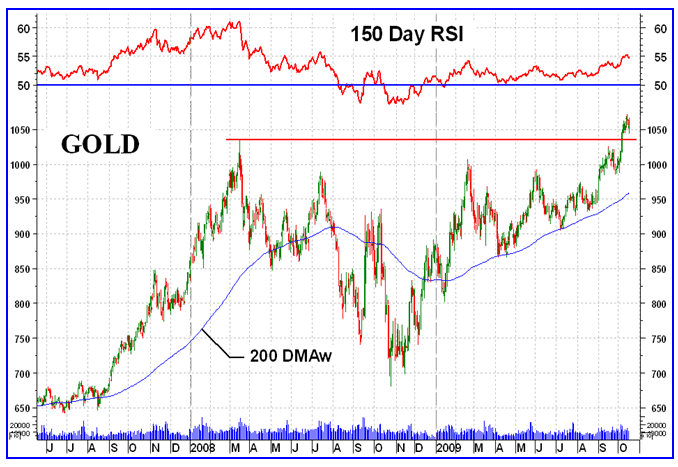
From a longer term standpoint the momentum indicator is not all that encouraging. Although the price of gold has moved into new all time highs, above its previous early 2008 peak, the long term momentum indicator is still far below its respective peak. This is what technicians call a negative divergence. It is not a good sign but as nothing is perfect it may or may not signal negative days ahead. What it does signal is that the odds favor the down side. Looking at the action another way, during the 2008 peak the momentum indicator topped out at 62% or 12% above its neutral level. This time we seem to be topping out at 56%, only 6% above the neutral level. The strength of the latest move to new highs may be seen as being half as strong as the strength behind the 2008 move.
The above is an attempt to gauge the potential for more upside action or the odds of a downturn. As there is no 100% certainty in any of these technical indicators (no fundamentalist can claim 100% accuracy either) the above is just an assessment of the most likely scenario ahead. However, it could be that the last year has been so confused that speculators and investors have been just sitting back and studying the situation and could come out of the wood work and push gold further into new highs. What is actually happening at the moment is what I try to assess here on a weekly basis.
So, where are we right now from the long term standpoint?
As mentioned last week we now have a very long term projection for gold to the $2050 level with a stop at $1575. There is still that projection to $1075 based upon the initial 2003 break-out which has not been reached (gold did get as high as $1072). Nothing new in the P&F charts this week.
As for the normal charts and long term indicators, gold closed the week well above its long term positive sloping moving average line so there is no immediate danger of a long term reversal of trend being confirmed. Note that a confirmation of a long term reversal ALWAYS occurs well after the top (or bottom) had been reached. The weakness in the long term momentum indicator has been noted above. However, the indicator is still in its positive zone and above its positive sloping trigger line. Of equal or greater interest is the volume indicator. It is in all time high territory confirming the price move. It is also above its positive sloping trigger line so all seems well with the world from a long term standpoint. The long term rating remains BULLISH.
INTERMEDIATE TERM
From an intermediate term standpoint I like using a 50 day version of the RSI. The two month period (50 days) leading up to the gold new highs is still showing weakness versus the two month period leading up to the previous high. Of greater importance from the intermediate term standpoint is its performance versus the previous move in the Jan/Feb period of this year. The momentum indicator is showing slightly higher strength now than during the Feb high. The difference is small but still on the up side.
Gold remains above its intermediate term positive sloping moving average line. The momentum indicator remains in its positive zone above its positive sloping trigger line. The volume indicator remains above its positive trigger line. All is still in place for a BULLISH intermediate term rating.
SHORT TERM
This is where trend changes should first be noticed. On the short term my momentum indicator of choice is still the RSI but a 13 day version. I know that very many technicians use a 14 day version but with so little difference between the two and the fact that 13 is a Fibonacci number, why tempt the technical gods? When one looks at the past 13 days of activity one can imagine that an indicator based upon such short period could get pretty volatile. This is so with the short term momentum indicator. It is not unusual for it to go right up into its upper or lower levels, which are considered as overbought or oversold levels. Once in these levels a short term reversal of price trend is very often the result.
In the past couple of weeks the indicator quickly moved into its overbought zone. It has stayed there for several days in the process giving us a short term negative divergence. The indicator has now moved below its trigger line and has moved lower below its overbought line (the 80% line). This too often is the signal that a short term reaction is or about to be in progress. How far it will go is anyone’s guess but the reaction a month ago is a good example.
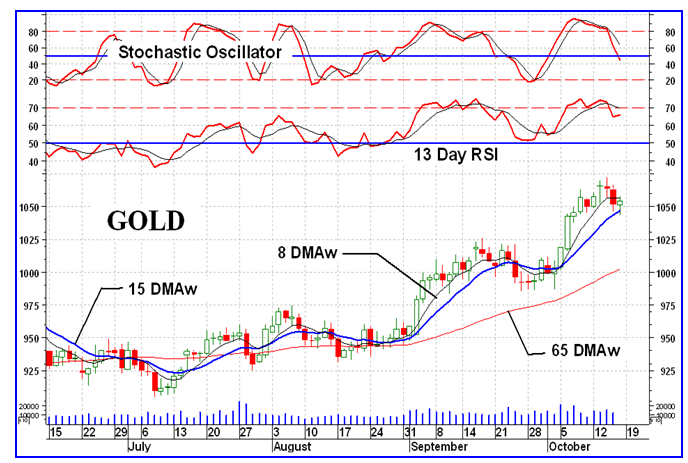
The gold price is just above its positive moving average line and the momentum indicator, although suggesting a reaction ahead, is still well in its positive zone but below its negative trigger line. The daily volume activity has been improving over the past month or so but lately has been diminishing, suggesting a cooling of speculative interest. The indicators still give us a BULLISH short term rating but the direction of activities suggests this may change in the very near future.
As for the immediate direction of least resistance, I’ll go to the more aggressive momentum type indicator, the Stochastic Oscillator. The SO turned downward and dropped below its trigger line a week ago, prior to Tuesday’s all time high gold price. It has remained below its trigger and has now moved into its negative zone. The gold price has also dropped below its very short term moving average line so all things considered the immediate direction of least resistance appears to be to the down side.
SILVER
Analyzing the actions of silver is getting interesting. Many things going on in the charts and indicators. The daily chart shows a slight reverse (widening) megaphone pattern. This is often seen as a bearish pattern. It is very minor at the present and may not come to anything. The volume indicator continues to zoom into new all time highs while the silver price still has much more to go to get to its new modern day highs. The intermediate term momentum indicator is showing a recent negative divergence suggesting weakness. The long term momentum indicator is similar to the gold momentum indicator, showing long term weakness in its resent upward moves. The short term momentum indicator is even more emphatic in its negative divergence message than is the gold indicator. The Stochastic Oscillator is diving straight downward and dropped below its overbought line on the same day that the price of silver was making its highest high, on Wednesday. All in all, the signs seem to suggest more downside ahead for silver.
Any downside is not envisioned as being of a serious nature. Looking at the silver stock action we have the quality stocks (Merv’s Qual-Silver Index) reacting lower with most of the precious metal stocks this week. We have the speculative silver stocks (Merv’s Spec-Silver Index) moving higher this week while most else around them are moving lower. This strength of the speculatives while the quality are neutral to slightly negative is a longer term sign of strength in the silver market. Speculators do not go for the speculative stocks unless they are very comfortable about the overall bullish position of the sector.
PRECIOUS METAL STOCKS
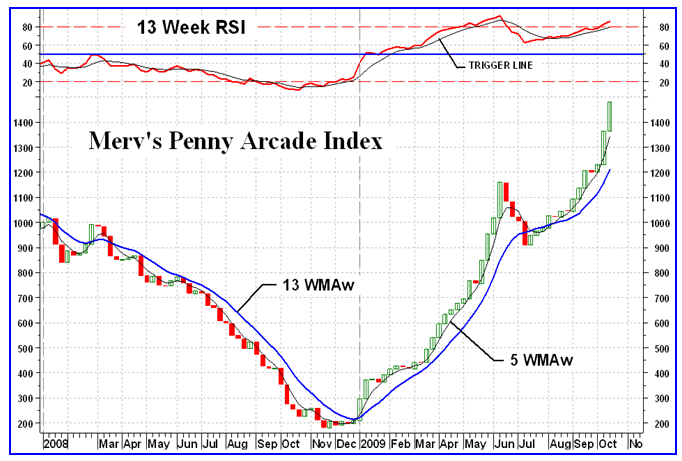
Up, up and away. Up another 8.6% for average performance of the Merv’s Penny Arcade Index this past week as most North American gold Indices were struggling with just staying above water. The Index is now well into new all time high territory. This wouldn’t last but in the mean time there is still much, much more upside potential in these stocks. The intermediate term momentum indicator is a concern as it is lagging behind the actions of the Index. I would be inclined to guess that these penny stocks are set for a rest or reaction ahead, and that would be a good thing. It would provide a consolidation period for the stocks to strengthen again for the subsequent move. The Index went through a major revision this past week, as it will often, however the stocks with major advances during the week (one advanced by 94%) have been in the Index for some time.
Although there are numerous gold Indices tracking the majors or second tier stocks I know of none that track the performance of the real penny stocks, the ones most likely to give you those 10 and 20 baggers (if you know of any such Index let me know at mervburak@gmail.com ). Because of the nature of penny stock activity these component stocks will be revised far more often than the components of other Indices.
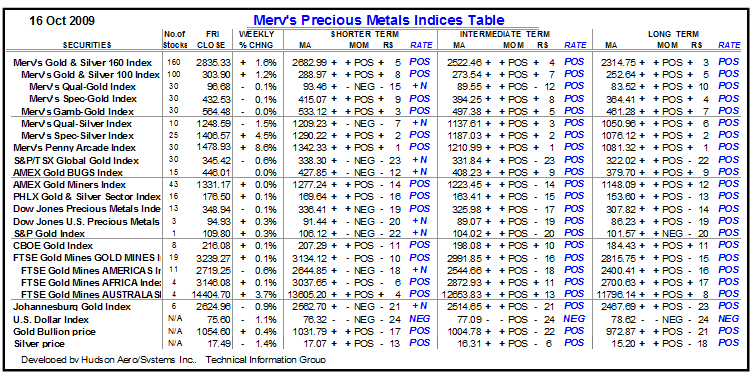
MERV’S PRECIOUS METALS INDICES TABLE
Well, that’s it for another week.
By Merv Burak, CMT
Hudson Aero/Systems Inc.
Technical Information Group
for Merv's Precious Metals Central
For DAILY Uranium stock commentary and WEEKLY Uranium market update check out my new Technically Uranium with Merv blog at http://techuranium.blogspot.com .
During the day Merv practices his engineering profession as a Consulting Aerospace Engineer. Once the sun goes down and night descends upon the earth Merv dons his other hat as a Chartered Market Technician ( CMT ) and tries to decipher what's going on in the securities markets. As an underground surveyor in the gold mines of Canada 's Northwest Territories in his youth, Merv has a soft spot for the gold industry and has developed several Gold Indices reflecting different aspects of the industry. As a basically lazy individual Merv's driving focus is to KEEP IT SIMPLE .
To find out more about Merv's various Gold Indices and component stocks, please visit http://preciousmetalscentral.com . There you will find samples of the Indices and their component stocks plus other publications of interest to gold investors.
Before you invest, Always check your market timing with a Qualified Professional Market Technician
Merv Burak Archive |
© 2005-2022 http://www.MarketOracle.co.uk - The Market Oracle is a FREE Daily Financial Markets Analysis & Forecasting online publication.