


Stock Market Failed Bearish Technical Setups May Be Bullish
Stock-Markets / Stock Index Trading Nov 15, 2009 - 05:56 PM GMTBy: Steven_Vincent

 "When a market doesn't do what it should do when it should do it then it may be about to do the exact opposite in a big way".
In spite of a slew of ostensibly bearish technical setups, the equities markets have refused to sell off. These technical failures may have setup a potentially powerful bullish resolution.
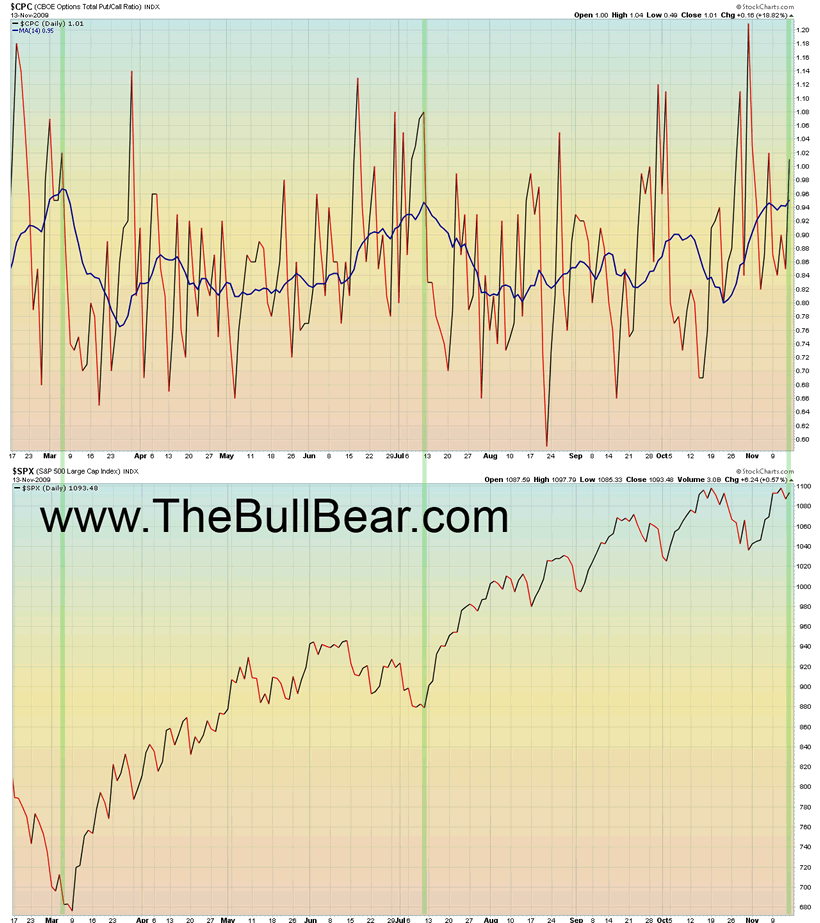
The 14 day moving average of the put-call ratio is at levels which in the past have corresponded with bottoms in the SPX. On Friday the PCR closed above 1.00 even though stocks rallied. This shows a substantial amount of fear even though the markets are at or very near their highs. From a contrarian perspective, this is very bullish and may be a setup for an upside extension of the rally off the March low. It bolsters the view that the period from August to the present may have been a running correction of the overbought condition on the RSI.
The ratio of New Highs to New Lows has plunged to levels not seen since early August and is showing signs of bottoming with the 14 day moving average now beginning to turn up. This may be another indication that the overbought condition has been worked off in a sideways-to-up trade in the August-November period, setting the market up for a strong continuation move.
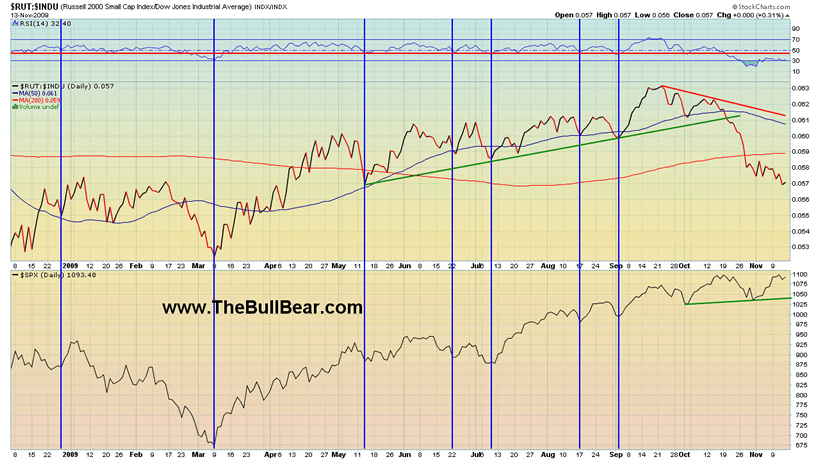
The ratio of the Russell 2000 small cap index to the Dow has plunged significantly. Generally, pullbacks in this ratio have coincided with pullbacks in the price of the SPX. This time, in spite of a major selloff in the ratio the SPX is hovering near its highs. Again, the failure of bearish technical conditions to produce bearish price action may be a positive divergence and a bullish setup.
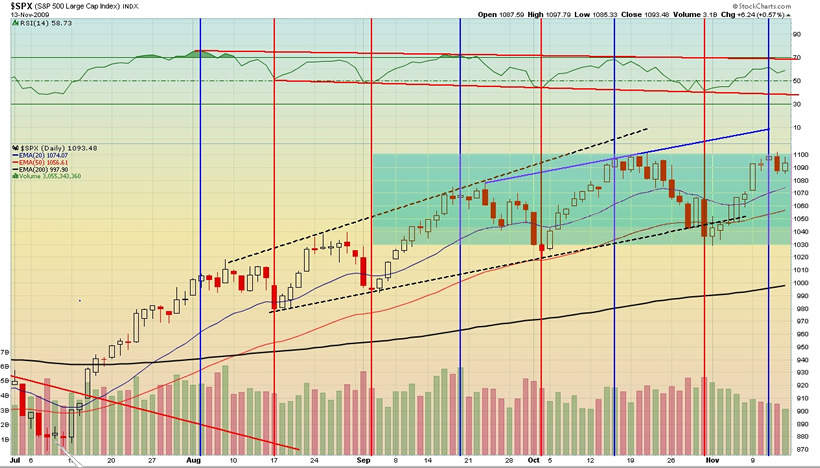
Of course we should also mention that the most recent rally has come on marked declining volume which is generally regarded as a bearish setup.
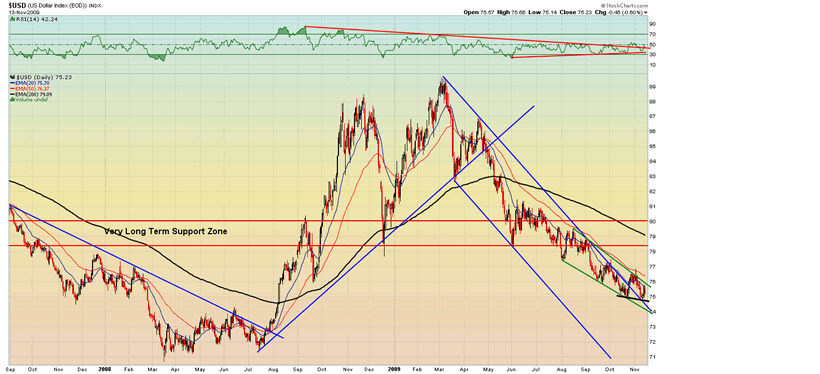
The US Dollar Index has repeatedly threatened to break out of a declining wedge(s) and has repeatedly failed. This sets up a possible downside acceleration to the 2008 lows. A dollar rally would be bearish for stocks and a dollar breakdown would likely correspond with and upside extension in equities.
Certainly if price can perform so well that it settles near its highs in spite of bearish technical setups then when and if those conditions reverse the upside potential may be magnified. On the other hand, it may be that the situation is pregnant with downside potential that has yet to be realized. The coming week should give us answers and a resolution.
Subscribe to my free BullBear Trading Service to get all the details of my trades as they develop.
The BullBear Market Report is live every Monday and Thursday after the closing bell. Call in with your questions, thoughts and observations.
Disclosure: No current positions.
By Steve Vincent
The BullBear is the social network for market traders and investors. Here you will find a wide range of tools to discuss, debate, blog, post, chat and otherwise communicate with others who share your interest in the markets.
© 2009 Copyright Steven Vincent - All Rights Reserved Disclaimer: The above is a matter of opinion provided for general information purposes only and is not intended as investment advice. Information and analysis above are derived from sources and utilising methods believed to be reliable, but we cannot accept responsibility for any losses you may incur as a result of this analysis. Individuals should consult with their personal financial advisors.
© 2005-2022 http://www.MarketOracle.co.uk - The Market Oracle is a FREE Daily Financial Markets Analysis & Forecasting online publication.