


Gold More Downside Expected
Commodities / Gold & Silver 2009 Dec 14, 2009 - 02:32 AM GMTBy: Mark_Brown

 Donald W. Pendergast writes: So, we’ve seen a substantial correction in the Gold market over the past couple of weeks, and that means that Gold is now ready to rocket higher to fresh highs, isn’t it? Probably not, at least not right away, and patient and wise traders/investors will want to wait a bit to see what Gold does as it interacts with any number of key support levels. Let’s take a closer look, hoping to ascertain when/where this current downdraft might expect to meet up with major support.
Graphic credits:
- Metastock v.11
- Metastock Profitunity (Bill Williams) expert advisor
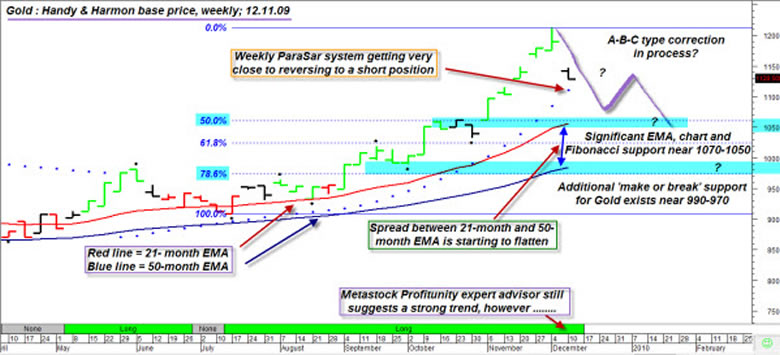
The weekly chart of cash Gold suggests that the fresh wave of selling, although getting close to significant daily chart support (near 1100-1100), is very likely to keep heading south toward the more significant weekly support levels depicted on the chart above. Here are some of the key technical highlights:
- The Parabolic Stop and Reverse system (J. Welles Wilder’s famed ‘ParaSar’ system), although still in ‘long’ mode, is getting precariously close to a stop and reverse (to short) signal (see the trailing string of ParaSar dots beneath the price bars). If it does go into short mode, existing speculative longs should consider closing their positions ASAP.
- The spread between the 21- and 50-month exponential moving averages (EMA’s) is flattening out for the first time in nearly five months, confirming the loss of upside momentum.
- The recent Commitment of Traders report from the CFTC suggests that commercial interests in the Gold futures market are still heavily short even as the large speculators (hedge funds and the like) are still overwhelmingly long. The action on the price chart means essentially one thing – the commercials are selling the large specs all the Gold they can handle, hoping to cover their short positions at lower prices in the weeks and months to come.
The Path of Least Resistance
While it is true that a market that has completed a move from $700 to $1,200 in the course of a year should be given every benefit of the doubt, the odds strongly suggest that the path of least resistance – given all of the aspects discussed above – in the Gold market remains toward lower prices. As shown on the chart, the next major confluence area of chart support, Fibonacci support and EMA support all converge near the area of 1070 to 1050. At that price zone we find the 50% Fib retracement of the July 2009 to December 2009 weekly upswing, along with the October 2009 swing highs (former resistance which may provide future support). Finally, we also find that the 21-month EMA also coincides with the same support zone.
In other words, expect to see major weekly support near 1070-1050, followed by a tradable bounce on the daily time frame. I’ve taken the liberty of drawing a hypothetical ‘A-B-C’ corrective wave (purple zigzag line on chart), one that may be proportional to the size of the major up thrust that preceded it. While no one knows exactly how this correction will play out, this ‘projection’ of how prices may respond might help keep trader’s focus on the importance of keeping on the right side of this highly volatile market.
Finally, there is also a very strong support area spanning the range from 979 to 990; this one is also characterized by another ‘three-fold cord’ (which cannot be easily broken) comprised of the 79% Fibonacci retracement, the 50-month EMA and the September 2009 swing low. This could be a vital support area for Gold – a significant breach beneath it could really unleash a tidal wave of mindless selling that could take months to repair. Essentially, traders need to see how Gold responds as it meets the first support barrier (1070 to 1050); some questions they need to consider are these:
How far does Gold retrace the plunge from $1,215 before falling lower again? And if Gold moves sharply lower from the initial support level (1070 to 1050) down toward the sub-$1,000 level, just how panicked are the sellers as they unload their long holdings? Are the commercials eagerly scooping up Gold from these discouraged longs or are they waiting for more opportune prices at which to rebuild their long positions?
The current bottom line in cash Gold:
Expect a decline toward 1070-1050 before seeing a tradable daily-based long swing setup appear. Existing speculative long Gold positions should be closed out if the weekly ParaSar system goes into short mode. Aggressive traders might even attempt to go short on any bounces higher on daily and/or 30-60 minute intraday charts. If we see an eventual drop toward the lower support area of 990-970, those seeking to acquire more Gold for their long-term ‘core’ position might find that to be an especially attractive area in which to initiate further purchases.
By Donald W. Pendergast Jr.
To receive more information on trading ETF funds visit my website: www.ETFTradingPartner.com
Mark Brown is an independent trader who focuses on trading ETF funds. He has been involved in markets and money management since 1998. His unique trading model which uses a combination of analysis like: economy, market cycles, chart patterns, volume, market internals, and money management. Visit his site: ETF Trading Partner www.ETFTradingPartner.com
© 2009 Copyright Mark Brown - All Rights Reserved Disclaimer: The above is a matter of opinion provided for general information purposes only and is not intended as investment advice. Information and analysis above are derived from sources and utilising methods believed to be reliable, but we cannot accept responsibility for any losses you may incur as a result of this analysis. Individuals should consult with their personal financial advisors.
© 2005-2022 http://www.MarketOracle.co.uk - The Market Oracle is a FREE Daily Financial Markets Analysis & Forecasting online publication.