


Key Price Levels for SPY, DIA, QQQQ, and IWM Stock Indices
Stock-Markets / Stock Index Trading Jan 14, 2010 - 05:11 PM GMTBy: Guy_Lerner

 It has been many months since I have looked at the key price levels on the ETF's that represent the major market indices. This used to be a regular feature back in the early days of this rally. I have recently renewed my interest in this methodology of determining significant turning points as these key price levels tend to represent important areas of support and resistance.
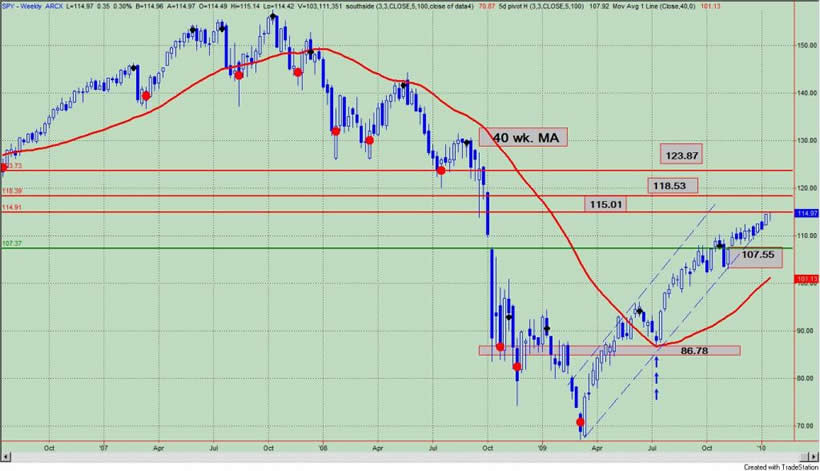
Key price levels are points where buying and selling are most likely to take place. With over 40 years of back tested data, I have defined these key price levels as a pivot point low occurring at a time when investor sentiment is bearish (i.e, bull signal). These key areas are shown with the red dots in figure 1, a weekly chart of the ETF proxy for the S&P500, the S&P Deposit Receipts (symbol: SPY).
The last most important key price level before this rally really took off was at 86.78, and as you can see that breakout point was actually retested back in July, 2009 (blue up arrows). But that was then and this is now, so let's try to determine where those resistance levels might be. Referring to figure 1 there are 3 key price levels just overhead on the SPY. The first is at 115.01 and this is a key pivot point from April, 2005. The second point is at 118.53 and this is from October, 2005. The last pivot is from July, 2008 and is at 123.87; this level also represents the breakdown that occurred back in October, 2008. Remember these are resistance levels.
As far as support or areas where buying might occur....well, what support? We don't need no stinking support. But if we go all the way back to August, 2004, there is support at 107.55
Figure 1. SPY/ weekly
A weekly chart of the Diamond Trusts (symbol: DIA) is shown in figure 2. The DIA is nearing a resistance zone between 108 and 111; the 120.09 or Dow 12,000 would be the next level up. Support comes in at 98.81.
Figure 2. DIA/ weekly
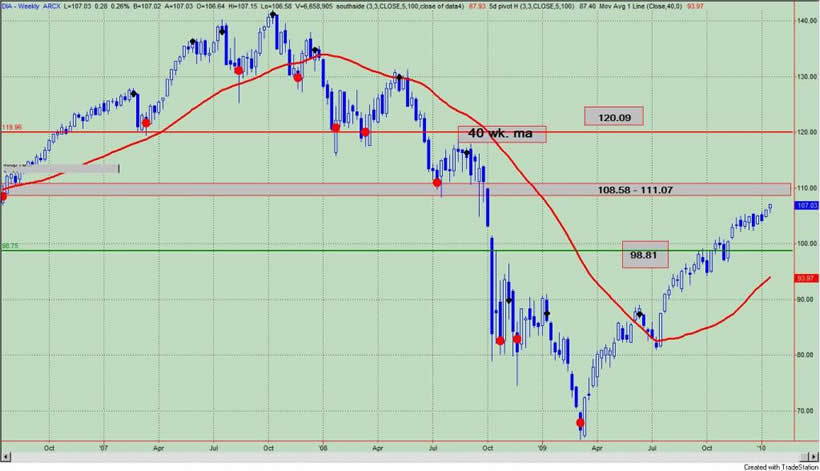
Figure 3 is a weekly chart of the Power Shares QQQ Trust (symbol: QQQQ). The QQQQ is fast approaching resistance levels at 46.87, but I am intrigued by the next level up, which stands at 50. In light up the fact that this market "never" goes down, 50 seems like a nice place for it to go but also a nice place for it to rollover. All this is still within the context of the blow off top. Current support (or old resistance) comes in at 44.17 and 42.19.
Figure 3. QQQQ/ weekly
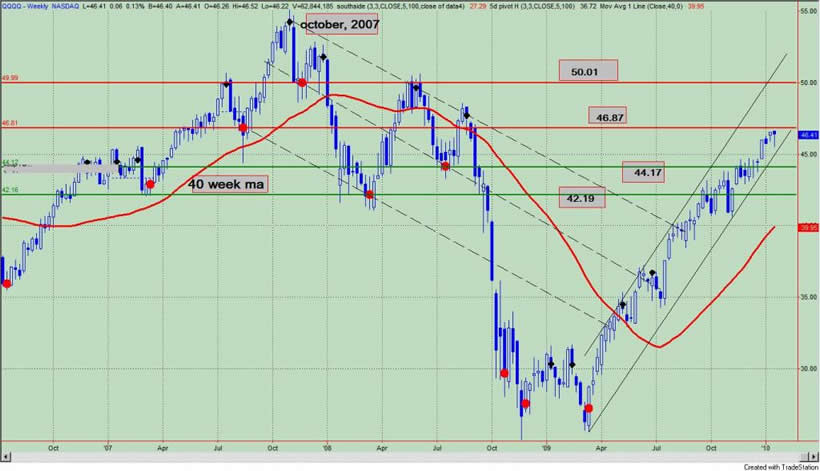
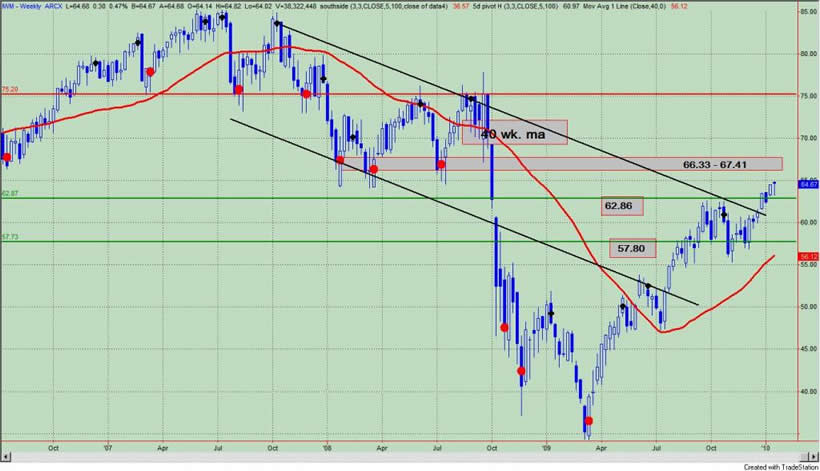
Figure 4 is a weekly chart of the i-Shares Russell 2000 Index (symbol: IWM). Mega resistance is directly overhead, and it was this area that "gave way" back in October, 2008. 57.80 would be a more logical area of support if and when the pullback comes. Who knows the market just may go up everyday until the end of time.
Figure 4. IWM/ weekly
By Guy Lerner
http://thetechnicaltakedotcom.blogspot.com/
Guy M. Lerner, MD is the founder of ARL Advisers, LLC and managing partner of ARL Investment Partners, L.P. Dr. Lerner utilizes a research driven approach to determine those factors which lead to sustainable moves in the markets. He has developed many proprietary tools and trading models in his quest to outperform. Over the past four years, Lerner has shared his innovative approach with the readers of RealMoney.com and TheStreet.com as a featured columnist. He has been a regular guest on the Money Man Radio Show, DEX-TV, routinely published in the some of the most widely-read financial publications and has been a marquee speaker at financial seminars around the world.
© 2010 Copyright Guy Lerner - All Rights Reserved
Disclaimer: The above is a matter of opinion provided for general information purposes only and is not intended as investment advice. Information and analysis above are derived from sources and utilising methods believed to be reliable, but we cannot accept responsibility for any losses you may incur as a result of this analysis. Individuals should consult with their personal financial advisors.
Guy Lerner Archive |
© 2005-2022 http://www.MarketOracle.co.uk - The Market Oracle is a FREE Daily Financial Markets Analysis & Forecasting online publication.