Alternative Explanation For S&P500 Rally Trim-Tabs Conspiracy Theory
Stock-Markets / Market Manipulation Jan 15, 2010 - 09:32 AM GMTBy: Andrew_Butter
 A recent post on Zero Hedge suggested that the “Non-Stop Rally Since March”, could have had a covert helping hand:
One way to manipulate the stock market would be for the Fed or the Treasury to buy $20 billion, plus or minus, of S&P 500 stock futures each month for a year. Depending on margin levels, $20 billion per month would translate into at least $100 billion in notional buying power. Given the hugely oversold market early in March, not only would a new $100 billion per month of buying power have stopped stock prices from plunging, but it would have encouraged huge amounts of sideline cash to flow into equities to absorb the $300 billion in newly printed shares that have been sold since the start of April.
This type of intervention could explain some of the unusual market action in recent months, with stock prices grinding higher on low volume even as companies sold huge amounts of new shares and retail investors stayed on the sidelines.
I have two points:
The first is that ONE thing and ONLY one thing causes a stock or an asset to go up in price, which is that there are more buyers than sellers.
So perhaps in March 2009 the sellers just said to themselves “Blow this, I’m going to go on holiday until I can get a decent price for my shares”. And perhaps they did just that. Outside of the “casino” where the players take bets that have to be covered in a certain time, no one HAS to sell a share if he doesn’t want to.
Remember, it’s not the games that the intermediaries play going long and short and buying and selling options that ultimately drives markets, it’s the end users. Sure the intermediaries can temporarily distort the market (or deliver better efficiency so that equilibrium is reached quicker – perhaps), but there are limits.
Ah you say but what about the volumes? “Those went right down, so that PROVES there was a conspiracy somewhere”.
Err…in a word, “no”!
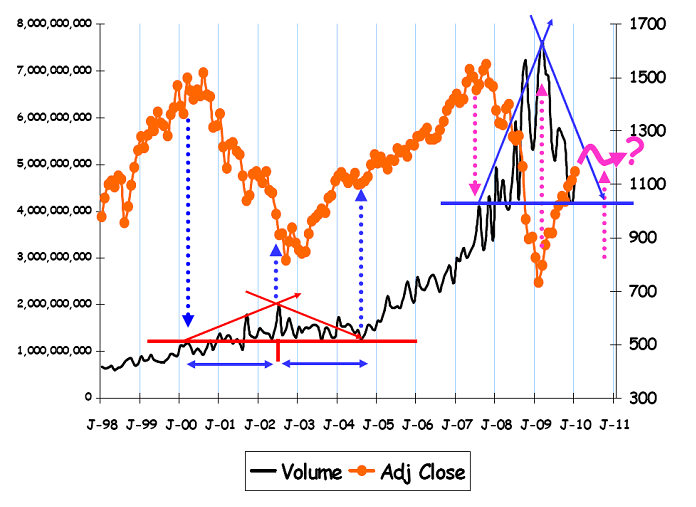
This is a chart comparing the volume on the S&P 500 (average monthly), compared to the Index (also monthly).

The way I read that chart:
1: What happened last time was that volume increased steadily from about the “pop” until about the bottom.
2: Then in the primary rally that followed it decreased steadily, for about the same time it had previously increased steadily and in aggregate at the same rate.
3: At the end of that cycle there was a drifting sideways then a pull-back.
OK, just one precedent, I haven’t looked at other busts, but carry that “pattern” forward to today, and sure unit volumes have gone up, that’s computers for you, but the pattern is remarkably similar.
1: Volume increased steadily from about the start of the pop to the bottom [√]
2: Then it decreased steadily at about the same angle picking up the line where the trough of the volume is the same as the peak of the volume that started the pop [√].
3: Didn’t get the pull back (that everyone is dreading), but many people (including me) are anticipating a drifting sideways in 2010.
Interestingly I’m on record saying that once it hits about 1,200 the chances of a pull back are quite high, which is about where that ends up if you eyeball the previous dynamic (the purple line).
The other reasons that I don’t think the Fed gamed the market are:
(a) I really don’t think they are that smart.
(b) I certainly don’t think they are that stupid either, in spite of everything that happened.
(c) To understand precisely when the bottom was is you had to understand BubbleOmics (that predicted the “turn” at 675), and since Ben Bernanke steadfastly maintains that he can’t even spot a bubble, let alone understand it’s dynamics, even if someone bashed him over the head with a copy of International Valuation Standards, I find it hard to believe that he recognised on 9th March that was the time to “Jump In”.
Incidentally there is a discussion about bubble dynamics at: http://www.marketoracle.co.uk/Article16461.html
By Andrew Butter
Twenty years doing market analysis and valuations for investors in the Middle East, USA, and Europe; currently writing a book about BubbleOmics. Andrew Butter is managing partner of ABMC, an investment advisory firm, based in Dubai ( hbutter@eim.ae ), that he setup in 1999, and is has been involved advising on large scale real estate investments, mainly in Dubai.
© 2010 Copyright Andrew Butter- All Rights Reserved
Disclaimer: The above is a matter of opinion provided for general information purposes only and is not intended as investment advice. Information and analysis above are derived from sources and utilising methods believed to be reliable, but we cannot accept responsibility for any losses you may incur as a result of this analysis. Individuals should consult with their personal financial advisors.
Andrew Butter Archive |
© 2005-2022 http://www.MarketOracle.co.uk - The Market Oracle is a FREE Daily Financial Markets Analysis & Forecasting online publication.


