


Stocks Plunge as Investors Hopes of Economic Recovery Might Have Got Ahead of Reality
Stock-Markets / Financial Markets 2010 Jan 17, 2010 - 04:43 AM GMT

 “Words from the Wise” this week comes to you in a somewhat shorter format as I do not have access to all my normal research resources while spending a few days with the gnomes in Geneva (also see my post “Blogging gone AWOL - to Switzerland“). Although the commentary is not as comprehensive as usual, a full dose of excerpts from interesting news items and quotes from market commentators is included.
With investors’ hopes of an economic recovery that might have gotten ahead of reality, the Dow Jones Industrial Index experienced its largest one-day drop (-0.9%) of the year in a sell-off on Friday - unnerved by China starting to rein in liquidity and cautious earnings guidance - causing the benchmark US indices to register a fourth down-week over an eight-week period. Not surprisingly, the CBOE Volatility (VIX) Index, also referred to as the “fear gauge” of US stocks, gained 1.2% over the week.
Providing “entertainment” of a dubious kind and reminding one of the 1933 Pecora Commission, the Financial Crisis Inquiry Commission on Wednesday started interrogating four of Wall Street’s top executives in Washington and promised to use wide-ranging powers to establish the causes of the financial crisis and pursue any wrongdoing.
Meanwhile, Christina Romer, who heads the president’s Council of Economic Advisers, said (via MoneyNews) the payment of big year-end bonuses for bailed-out financial institutions would be “ridiculous” and “offensive” and “is going to offend the American people. It offends me”.
Similarly, according to The Canadian Press, President Barack Obama said with reference to his proposed plans to impose a levy on big financial institutions to recoup some of the costs of the financial crisis: “If the big financial firms can afford massive bonuses, they can afford to pay back the American people.”
Source: Steve Sack, Comics.com
The past week’s performance of the major asset classes is summarized in the chart below - a set of numbers indicating a degree of risk aversion has crept back into financial markets. Steps by the People’s Bank of China to tighten liquidity by increasing the bank reserve requirement ratio and raising inter-bank interest rates negatively impacted oil and other commodities, causing the first decline in five weeks.
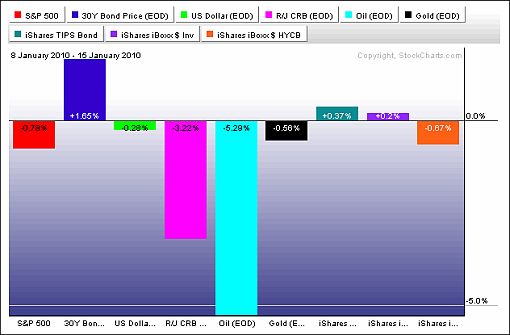
Source: StockCharts.com
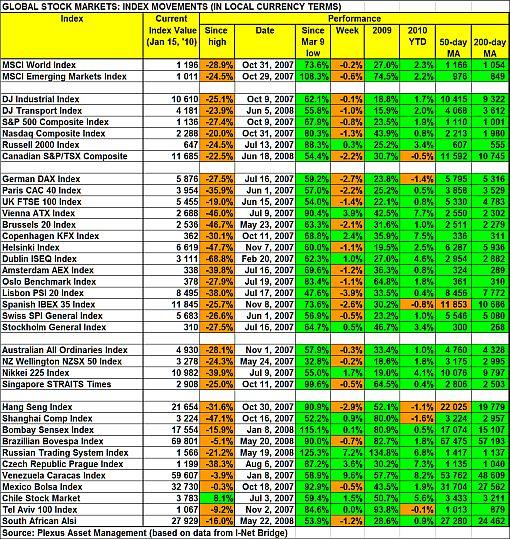
A summary of the movements of major global stock markets for the past week and various other measurement periods is given in the table below.
The MSCI World Index and the MSCI Emerging Markets Index declined by 0.2% and 0.6% respectively during the past week. Among mature markets, Japan (+1.7%) bucked the trend and added a seventh consecutive week of gains - coinciding with a weaker yen over the period. (Also see my post “What to expect from Japan’s new finance minister“.) Among emerging countries, Russia (+7.2%) performed solidly, while China (+0.9%) also eked out a gain after having to balance adverse monetary developments in that country with impressive trade data early in the week.
Notwithstanding the huge rally since the March lows, only the Chile Stock Market General Index - again a solid performer on the expectation of a positive election result - has been able to reclaim its 2007 pre-crisis peak and is now trading 8.1% higher. Mexico could be the next country to eliminate the bear market losses.
As far as the US indices are concerned, Wall Street managed to hit 16-month highs on Monday and then again on Thursday, but reversed course on Friday as traders closed positions before the Martin Luther King long weekend, pulling indices into the red.
Seven of the ten economic sectors (as measured by the SPDR exchange-traded funds [ETFs]) closed lower for the week, with the defensive sectors outperforming the cyclical ones. Health Care (+1.4%), Consumer Staples (+0.8%) and Utilities (+0.6%) returned gains, whereas all the other sectors were under the water. Small caps, in particular, led the way down on Friday.
Click here or on the table below for a larger image.
Top performers among stock markets this week were Estonia (+15.6%), Venezuela (+9.6%), Lithuania (+8.7%), Kazakhstan (+7.2%) and Kenya (+5.7%). At the bottom end of the performance rankings, countries included Greece (-7.9%), Jamaica (-6.7%), Cyprus (-6.5%), Luxembourg (-4.9%) and Portugal (-1.2%). “Greece on Thursday announced an ambitious three-year plan to curb its runaway budget deficit but failed to convince skeptical markets that its targets for growth and fiscal reform were feasible,” reported the Financial Times.
Of the 96 stock markets I keep on my radar screen, 53% recorded gains (last week 79%), 41% (15%) showed losses and 6% (6%) remained unchanged. The performance map below tells the past week’s rather bullish story
Emerginvest world markets heat map
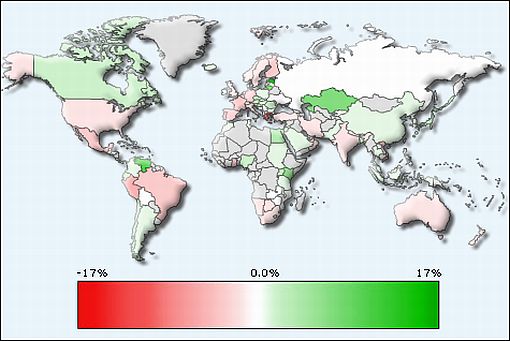
Source: Emerginvest (Click here to access a complete list of global stock market movements.)
John Nyaradi (Wall Street Sector Selector) reports that as far as ETFs are concerned the winners for the week included iShares MSCI Japan (EWJ) (+4.8%), Claymore/Delta Global Shipping (SEA) (+3.6%), Vanguard Extended Duration Treasury (EDV) (+3.3%) and iShares MSCI Austria (EWO) (+2.7%).
At the bottom end of the performance rankings, ETFs included Claymore/MAC Global Solar Energy (TAN) (-8.7%), PowerShares WilderHill Clean Energy (PBW) (-7.2%), Claymore/AlphaShares China Real Estate (TAO) (-6.6%) and United States Oil (USO) (-5.7%).
Referring to the modern robber barons, or “banksters”, and Obama’s proposed bank tax to recoup bailout costs, the quote du jour this week comes from long-timer Richard Russell, writer of the Dow Theory Letters. He said: “Obama is fighting two wars, the war in Afghanistan and the war in Iraq. Now he’s got a third war going, the war on Wall Street. He’s joining the populist fury over Wall Street and its bonuses. It’s ‘payback time’, and Obama proposes a $90 billion tax on Wall Street’s banks.
“The Prez utters the words the crowd loves to hear, ‘We want our money back, and we’re going to get it.’ Obama’s words dovetails with Democrats’ worries that they would be blamed for the recession and the debts. Blame it on Wall Street, and get even with those greedy devils; maybe tax the greedy devils out of existence or at least tax their stinkin’ bonuses away. As Obama’s assistant Rahm Emanuel put it, ‘Its a shame to let a good crisis go to waste.’
“The $90 billion Obama will extract from Wall Street won’t even begin to shrink the monster deficit the Fed has run up. Let the next administration (probably Republicans) deal with that problem.”
How the lie of the land has changed! The Financial Times yesterday headlined an article: “Obama is right to clobber Wall Street”.
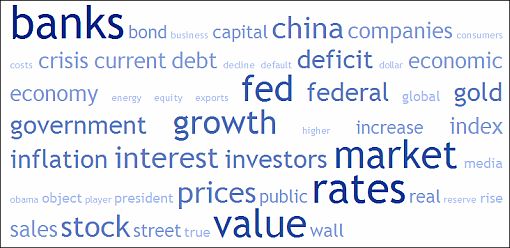
Next, a quick textual analysis of my week’s reading. This is a way of visualizing word frequencies at a glance. As to be expected with the banking shenanigans moving to center stage, “banks” commanded poll position.
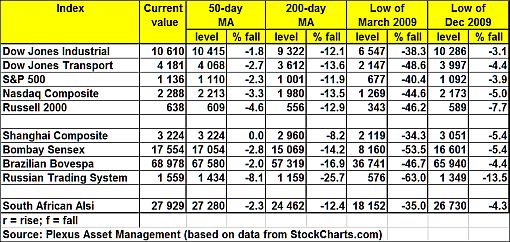
The major moving-average levels for the benchmark US indices, the BRIC countries and South Africa (where I am based in Cape Town when not traveling) are given in the table below. With the exception of the Shanghai Composite Index (discussed above), the indices in the table are all trading above their 50-day moving averages, with all the indices also comfortably above their respective key 200-day moving averages.
As far as the S&P 500 Index is concerned, an upward sloping trend line extends from the August lows. A break below this line’s support level of 1,080 (and the December low of 1,092) could signal a deeper pullback.
Click here or on the table below for a larger image.
Last week I discussed a long-term chart of the S&P 500. Let’s now also consider monthly data, going back to 1998, for the 10-year Treasury Note. As shown below, the MACD oscillator provided a sell signal about seven months ago and Treasuries are still classified as being in a primary bear market.
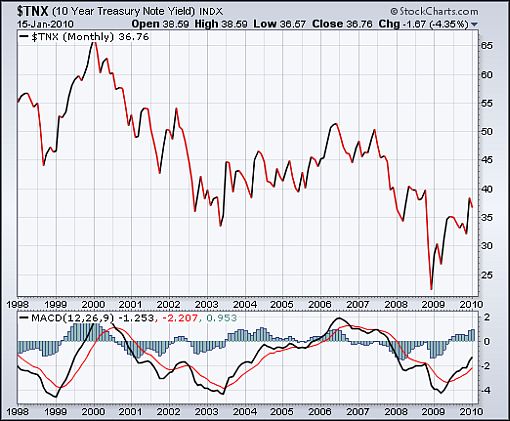
Source: StockCharts.com
This raises the question of when rising long-term rates start ruining the equity party. “For me, a sustained move above 4% by ten-year Treasuries will be equivalent to a yellow caution light for equity investors. Above 5%, stock markets could be in dangerous territory, as we saw in the last cycle,” commented David Fuller (Fullermoney). ”I will continue to view US Treasury 10-year yields as a lead indicator. Currently, they are still in a ’sweet spot’. However, when they move higher I will monitor stock market indices, particularly for Wall Street, even more closely for signs of fatigue in the form of inconsistencies, not least a loss of upward momentum.”
Looking beyond the low-growth economies of mature countries, Jeremy Grantham of GMO said (via Fortune): “I think there is a nascent bubble in emerging markets. Over the next three to five years, emerging markets are likely to sell at a handsome premium P/E because of the respect for their higher GDP growth.”
To which money man Bill Gross, head honcho of Pimco, added (according to Fortune): “If you’re looking for growth, you should venture outside the US. Brazil, China and other Asia equities are the cherry on top of the melting sundae. It’s not only their internal economies; they’re in better shape from the standpoint of reserves and balances. Ten years ago Brazil was a basket case and beggar. Now it has hundreds of billions of dollar reserves.”
Back to the US stock markets, John Hussman (Hussman Funds) is treading carefully with the current stock market make-up, saying: “There’s no denying that the beliefs of investors have been far more important, in the intermediate term, than economic realities, which are revealed more slowly and sporadically. Yet despite the high level of bullishness here, the market has gained only a few percent beyond its September highs. Most of what we are seeing now is a tendency to make marginal new highs, back off slightly, and then recover that ground enough to register another marginal new high.
“As I’ve noted frequently, when market conditions are characterized by unfavorable valuations, overbought conditions, over-bullish sentiment, and upward yield pressures, the market’s tendency is exactly that - to make continued marginal new highs for some period of time, followed by abrupt and often steep losses virtually out of nowhere.”
As we embark on the earnings season, the S&P 500 as a whole is expected to grow by 62.1% in Q4 2009 versus Q4 2008. As shown in the graph below, courtesy of Bespoke, the bulk of the growth is expected to come from the Materials and Financial sectors - the only two sectors with Q4 growth expectations that are higher than the S&P 500. Technology and Consumer Discretionary are the other two sectors expected to see growth. On the other hand, “Energy and Industrials are both expected to see earnings decline by more than 20% in the fourth quarter, while Telecom is not far behind at -19.2%. Health Care, Consumer Staples, and Utilities are all expected to see a drop of about 5%,” said Bespoke.
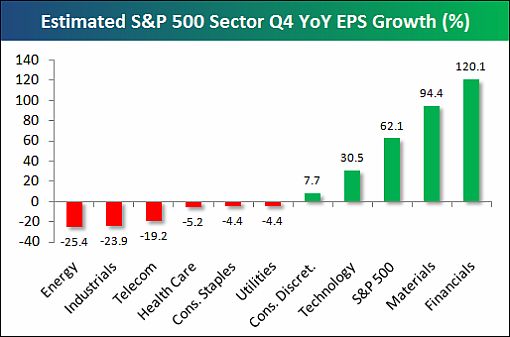
Source: Bespoke, January 12, 2010.
I do not have much to add to my conclusion of last week and repeat it: “It goes without saying that the strong rally since March is bound to be followed by a correction at some stage. But rather than pre-empting (and more often than not getting it wrong as a result of short-term noise), I will be guided by the longer-term charts and the yield curve to identify a major top. Meanwhile, I am watching valuations carefully, and specifically how the Q4 earnings reports stack up. (See my post “Earnings into focus“.)
“Although I am treading with caution after the 74% rally in the mature markets and 108% in emerging markets, I am not ignoring good old stock-picking, and specifically those companies with strong balance sheets that will be growing their dividends over time with a reasonable degree of certainty.”
The article continues here
By Dr Prieur du Plessis
Dr Prieur du Plessis is an investment professional with 25 years' experience in investment research and portfolio management.
More than 1200 of his articles on investment-related topics have been published in various regular newspaper, journal and Internet columns (including his blog, Investment Postcards from Cape Town : www.investmentpostcards.com ). He has also published a book, Financial Basics: Investment.
Prieur is chairman and principal shareholder of South African-based Plexus Asset Management , which he founded in 1995. The group conducts investment management, investment consulting, private equity and real estate activities in South Africa and other African countries.
Plexus is the South African partner of John Mauldin , Dallas-based author of the popular Thoughts from the Frontline newsletter, and also has an exclusive licensing agreement with California-based Research Affiliates for managing and distributing its enhanced Fundamental Index™ methodology in the Pan-African area.
Prieur is 53 years old and live with his wife, television producer and presenter Isabel Verwey, and two children in Cape Town , South Africa . His leisure activities include long-distance running, traveling, reading and motor-cycling.
Copyright © 2010 by Prieur du Plessis - All rights reserved.
Disclaimer: The above is a matter of opinion and is not intended as investment advice. Information and analysis above are derived from sources and utilizing methods believed reliable, but we cannot accept responsibility for any trading losses you may incur as a result of this analysis. Do your own due diligence.
Prieur du Plessis Archive |
© 2005-2022 http://www.MarketOracle.co.uk - The Market Oracle is a FREE Daily Financial Markets Analysis & Forecasting online publication.