


Stock Market, Gold Meltdown and U.S. Dollar Strength
Stock-Markets / Financial Markets 2010 Jan 21, 2010 - 01:21 AM GMTBy: Chris_Vermeulen

 For the past few weeks I have been expecting the market to correct. By looking at the price action on the weekly and daily charts we can see that there has not been any real pullback since November and that is important to note. Without regular market corrections stocks start to become over bought meaning everyone has/is buying them and no real sellers have jumped off the trend. So when the price in an over bought market starts to slide lower we generally see everyone rush to hit their sell buttons. This is what causes the high volume breakdowns similar to the GLD (Gold) breakdown last December.
Another way of getting a feel for the market to know if it is over bought is to look at market sentiment for bulls vs. bears (buyers vs. sellers). Currently almost everyone is bullish and with this high of a reading we must start protecting our positions by tightening stops and/or get ready to play the coming correction with a short term trading strategy.
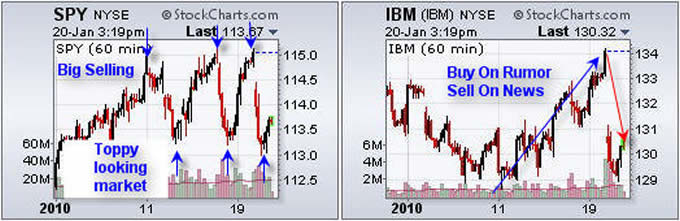
We can add another level of analysis to assist our understanding of the market if we look at the 60 minute charts of the SPY & IBM.
The chart below of the SPY (SP500) clearly shows we are in choppy times. With the majority of investors buying up stocks left, right and center because they are bullish on both the economy and individual companies, we have continued to see the index crawl higher. This has been going on for almost 3 months now but the more recent price action in the SPY chart clearly shows there are some BIG sellers unloading positions into this buying pressure. When the big sellers slow their selling we see the price drift back up until selling kicks back in. This is a warning signal for lower prices in the coming days.
The IBM chart shows a perfect example of the ‘Buy on the Rumor – Sell on the News’ saying we all know. The share price of IBM ran up into their earning news as traders know IBM is great for beating estimates. Once the great news came out which actually beat the estimates, the price sold off. This is happening everywhere with stocks.
In short, the market looks top heavy and has also rallied into earning season. These two points really have me on edge for taking a long trade at the moment.
Gold Stocks and the Dollar
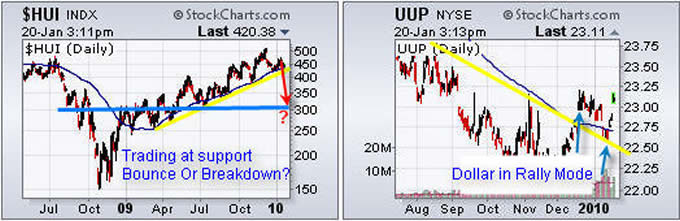
The HUI (Gold Stock Index) has been on fire the past 10 months. Both gold and gold stocks have been leading the market higher. But the past month we have seen gold stocks under perform the SP500 and as of today are testing a key support level. Only time will tell if it bounces or breaks, so keep a close eye on your positions.
I use the UUP etf of the US Dollar to show the price action of today’s price move. The US Dollar is now above a key resistance level and has started to move higher. If the Dollar continues higher commodities across the board will have downward pressure. This could trigger a large sell off in the gold and gold stocks which I think are still over bought using a short term time frame.
Gold & Oil Futures Trends
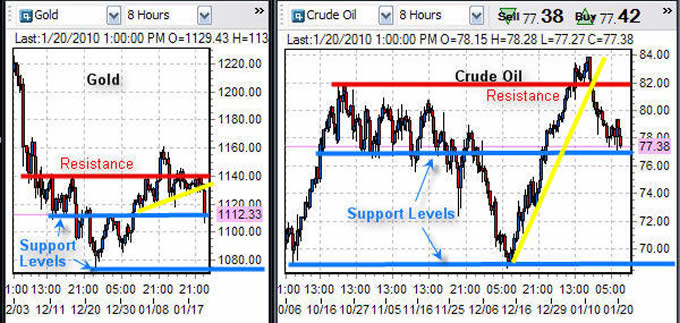
The trend of gold and oil has been down the past few days. Gold broke down in the past 24 hours in overnight trading which triggered a wave of selling when the US market opened.
Gold and oil are currently trading between key support and resistance levels. I am looking for gold to drift back up to the $1130 level where I will look for a short setup as the current price action is not bearish on the intraday charts.
Oil is still bullish so I am not really looking to short it at this time. I will wait for another low risk buy signal.
Commodity Trading Conclusion:
I feel the broad market could be ready for a large correction ranging from 5-10%. I am calling it a correction as I want to stay positive thinking. But it could be the start of a major market top. Market tops tend to be a process and take several months to roll over. So let’s focus on protecting our money and wait for a pullback that will allow us to load up with some great positions in the coming weeks.
Patience is how money is made in the market. Waiting for the market to come to you is vital for success. Also having the patience to let winners run by scaling out (selling a portion) of a position when the price reaches a support or resistance level makes it easier to let them run. Each time you sell some of a position you are locking in a profit and lowering your risk for the balance of that trade.
To Your Financial Success,
By Chris Vermeulen
Chris@TheGoldAndOilGuy.com
Please visit my website for more information. http://www.TheGoldAndOilGuy.com
Chris Vermeulen is Founder of the popular trading site TheGoldAndOilGuy.com. There he shares his highly successful, low-risk trading method. For 6 years Chris has been a leader in teaching others to skillfully trade in gold, oil, and silver in both bull and bear markets. Subscribers to his service depend on Chris' uniquely consistent investment opportunities that carry exceptionally low risk and high return.
This article is intended solely for information purposes. The opinions are those of the author only. Please conduct further research and consult your financial advisor before making any investment/trading decision. No responsibility can be accepted for losses that may result as a consequence of trading on the basis of this analysis.
Chris Vermeulen Archive |
© 2005-2022 http://www.MarketOracle.co.uk - The Market Oracle is a FREE Daily Financial Markets Analysis & Forecasting online publication.