


World in Chaos and Market Meltdowns, Too Costly To Bear
Stock-Markets / Financial Crash Feb 05, 2010 - 07:25 PM GMTBy: Doug_Wakefield

 Though this piece was originally released via our paid research publication – The Investor’s Mind – in September 2006, if not timeless, its contents are certainly applicable to our current markets and economic environment. While we have taken the liberty of updating some of the charts, it is largely unchanged:
“It does not matter how frequently something succeeds if failure is too costly to bear.” – Solon
I have often stopped to ponder our human condition – specifically, our uncanny ability to dismiss the seriousness of an event beforehand and to lament our lack of preparation after it has happened. In some form or fashion, how many New Orleans residents stated that they never expected the storm to break the levees? But it’s easy to see the rationale behind their unresponsiveness: they had been through countless storms since the levees were first established, and nothing that calamitous had ever happened.
It’s easy to look back, after an event, and wonder why people didn’t heed the warnings. But don’t we act similarly every day with our own health or the way we drive our cars? Because we have so many experiences where nothing drastic has happened, we dismiss the likelihood that anything will happen. We have heard so many warnings about the stock market, our nation’s debt, or the unregulated derivatives market. Yet life goes on like before – for on one more week, one more month…one more year. No wonder we don’t change our investment strategies.
History is replete with examples of ignored warnings before cataclysmically destructive events. Be it the passengers on the Titanic or the investors in 1929, unheeded warnings combined with ignorance to produce tragedy. Consider these words spoken by Cyrus C. Miller, president of the proposed New York Real Estate Securities Exchange, which was slated to open in October of 1929. In July of that fateful year, speaking of the benefits of this new market, Miller states: 2
“Stabilization of the real estate values will be an outstanding achievement through its tendency to curtail blind speculation and its strong emphasis on the aspect of sound investment.” 3
In his book, Money of the Mind, James Grant observes how unaware Wall Street was of the looming Crash of ’29 and the ensuing Great Depression.
“The new exchange could hardly have opened at a worse time. It was the month of the Great Crash. What almost nobody foresaw was the significance of that break to real estate or to the cozy business of real estate bonds.” 4
Over the last thirty-one months (now six years), we have written of numerous reasons that we should all be preparing for an economic storm. As I watch individuals trusting in watertight bulkheads that are only ten feet above the waterline while they scoff at the unnecessary lifeboats, which they do not realize are too few in number, I am baffled.
As in the August issue, we will look once again at the warning signals that science and nature can reveal to investors. As we continue through the fog and iceberg-infested waters of the investment world, we will slow speed and look at patterns in nature and the markets, which are clearly warning signals.
The Nile is a River in Egypt

The year was 1906. Harold Edwin Hurst, a young English civil engineer, had just arrived in Cairo for what was intended to be a short stay. The British Empire had recently put down the fundamentalist Mahdi revolt upriver in Sudan, and the Union Jack was raised over Egypt. In order to harness the Nile’s enormous economic power and control its floods, the Aswan Dam was completed in 1902. Yet the initial design was soon found to be inadequate and the British began planning to build a larger dam, the Aswan High Dam. 5
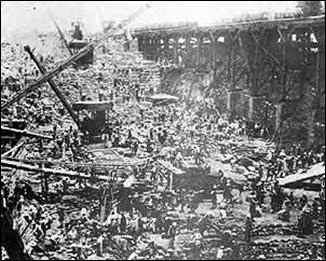 The picture to the left shows the construction of the Aswan Dam. The problem was that the Aswan Low Dam, as the first dam has come to be known, was built upon the same bell curve distribution assumptions as Bachelier’s random walk hypothesis. You see, engineers at the time assumed that flood variations were statistically independent. The conventional methods of that day suggested that the new dam should be twice as high as the old dam. Yet, according to his calculations, Hurst’s concluded that the dam should be much higher. He had found that the Nile’s water range widened faster than the bell curve assumed it would and that it contained higher highs and lower lows. His observations led him to conclude that the weather came in runs with back-to-back years of flooding and back-to-back years of drought. 6
Hurst’s collection of data revealed that the amount of water coming through the Nile not only varied greatly, but it also clustered. As he continued studying the Nile, he also collected annual water levels from Sweden’s Dalalven Lake; rainfall from Adelaide, Australia to Washington D.C.; the thickness of lakebed sediments in Russia, Norway, and Canada; temperature readings from St. Louis to Helsinki; and the pattern of tree rings in Flagstaff pines and Sequoias. In almost all cases, when Hurst plotted the number of years measured against the high-to-low ranges, he found, that just like his observations of the Nile, the range widened too quickly to fit within a bell curve. Though his calculations greatly differed from the norms of his day, Hurst discovered that all of these observations could be accounted for with the same basic formula. 7
As an example, in order to calculate what size a reservoir New York would need to keep water in steady supply for a century, Hurst reviewed its rainfall. After looking at about 120 years of data, he found that, because of a clustering effect, the reservoir would need to be much larger than was first thought. While the standard deviation of rainfall in New York averaged only 6.3 inches per year, his formula showed that the reservoir needed to be built to accommodate up to 105 inches, or 16.7 times its standard deviation. 8
In 1963, along the Charles River, a long way from the Nile, a professor who was teaching economics at Harvard discovered Hurst’s work. After observing over 100 years of cotton prices, the professor had published a paper revealing that cotton price movements hadn’t fit Bachelier’s model and that the historical price movements didn’t follow a constant standard deviation, but one that shifted over time. There were too many big price jumps and falls. 9
After class one day a student made the following observation to the professor, “You know you have a power law here. I’ve heard that a power law was also found by a hydrologist. He finds some strange exponent for the Nile floods. Maybe it’s ridiculous. But maybe it’s the same thing. You may want to check.” 10
The professor, of course, was Dr. Benoit Mandelbrot. He discovered that prices, like rainfall, had back-to-back years of wide movements and back-to-back years of narrow movements. Mandelbrot notes:
“The size of the price changes clearly cluster together. Big changes often come together in rapid succession, like a fusillade of cannon fire; then come long stretches of minor changes, like the pop of toy guns.” 11
Mandelbrot even came up with terms, from his Jewish heritage, which describe these phenomena vividly. Both terms came from the Bible’s Old Testament.
In Genesis 7:4 God says to Noah, “I will cause it to rain upon the earth forty days and forty nights; and every living substance that I have made will I destroy from off the face of the earth.” Mandelbrot called the catastrophic changes the Noah Effect. The Crashes of ’29, ’87, and 2000 would fit within this category. Today, we might call this the Perfect Storm.
The smaller changes, Mandelbrot termed the Joseph Effect. Undoubtedly, this comes from Genesis 41: 28 – 30, where Joseph says to Pharaoh, “What God is about to do he showeth unto Pharaoh. Behold, there come seven years of great plenty throughout all the land of Egypt: and there shall arise after them seven years of famine; and all the plenty shall be forgotten in the land of Egypt; and the famine shall consume the land.”
The chart below, of the volatility index (the VIX), allows us to observe the Noah and Joseph effects.
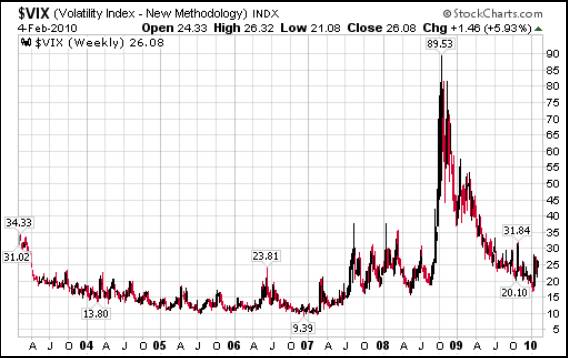
(Chart updated to February 4, 2010)
Yet, because Mandelbrot’s findings were not in line with all of the fields that projected needs based on the bell curve assumption of distributions, his conclusions were considered controversial. 12
Looking for Clusters
Digging deeper, I turned to a friend of mine, Dr. John Quintanilla, a professor of mathematics at the University of North Texas. When I asked Dr. Quintanilla if he knew of any research or articles regarding fat tails, he told me that he could not think of any (major) recent works since the material about fat tails had been around for over 40 years. Dr. Quintanilla suggested that I search the term, “extreme valuation distribution” so that I would understand the scientific importance of fat tails.
The extreme value theory is a branch of statistics that deals with distributions that do not follow a bell curve assumption. This branch studies standard deviations that are much wider than “normal” and tend to have fat tails, which means the values tend to cluster at the extremes. Though it is utilized in many fields, the extreme value theory becomes very important to scientists who assess risk for highly unusual events, such as 100-year floods.
Basically, when a scientist observes the clustering of certain data, it’s a signal to sit up and take notice. Now, since these are only probabilities, the clusters do not assure the observer a 100 percent accurate storm warning or exactly when and where a storm will hit. After all, storms, by nature, display wild randomness. Yet, as Taleb notes in our opening quote, if we do not possess the tools to discern rising risk levels, and we proceed blindly into a hurricane, then we are undone. As for any “false alarms,” the avoidance of a catastrophic event more than compensates for any prior inconveniences.


Though the 1980 eruption of Mount St. Helen shocked many, the scientists who had been studying its behavior for months, though awed, were not caught off guard. They had seen the visible ground deformation (due to stress) move up to a meter a day. They had noted increased eruptions of gas and steam. And then, on one fateful day, a thousand small earthquakes built into a magnitude 5, which breached Mount St. Helen’s carapace, resulting in its devastating eruption. 13
As a matter of fact, recent research shows that earthquakes seem to cluster in time more than would be expected from a random, bell curve assumption. 14 Today, we can look back on the eruption of Mount St. Helen and know that the clustering of thousands of small earthquakes preceded, and in so doing foretold, the major earthquake and the major eruption, which occurred on May 18th of 1980.
Market Meltdowns
Black Tuesday (1929) and Black Monday (1987) are memories that haunt most investors. And yet, as our writing over the last two (seven) years reveals, these events did not occur without reason. The data clustered, warning investors of the rapidly growing financial risk, far in advance of the event.
But, before we go on to look at Black Monday, I remind us that, from the rare event to the most commonplace day, history doesn’t recognize the conventional finance models. Once again, let us consider Mandelbrot’s words:
“In fact, the bell curve fits reality very poorly. Theory suggests that over time, there should be fifty-eight days when the Dow moved more than 3.4 percent; in fact, there were 1,001. Theory predicts six days of index swings beyond 4.5 percent; in fact, there were 366. And index swings of more than 7 percent should come once every 300,000 years; in fact, the twentieth century saw forty-eight such days. Truly, a calamitous era that insists on flaunting all predictions. Or, perhaps, our assumptions are wrong.” 15
As anyone can see from the evidence that Mandelbrot presents, our financial markets are much more volatile than theories would lead investors to believe. The panic buying and selling of tech stocks in 2000, the eventual collapse of multiple bond markets due to the enormously leveraged positions of Long Term Capital Management, and the destruction brought about when program trading platforms all lined up to sell on Black Monday, remind us of how volatile markets can be.
Even today, billions of dollars in our capital markets are working off of the theory that prices deviate from the mean only by two or three standard deviations. Perhaps this is what caught some off guard when natural gas recently shed 59 percent. Unfortunately, the leverage of some of these players exacerbated this selloff.
Regarding fat tails, Wikipedia notes, “According to the theoretical distribution, events that deviate from the mean by five or more standard deviations (“5-sigma event”) are extremely rare, with a 10- or more sigma being practically impossible.” 16 Again, the likelihood of such an occurrence is thought to be so infinitesimally small that investors and managers should not even have to consider it when managing risk. But, what do we do with Black Monday, when prices moved by a standard deviation of 22.
Liquidity Dries Up in the Hundred-Year Flood
The Crash of ’87 brought liquidity risk to the forefront. In reviewing the events surrounding the ‘87 crash, Dr. Bruce Jacobs stated the following regarding portfolio insurance (an early form of program trading):
“…all insurance programs utilize a common rule; they buy as prices rise and sell as they fall. A large enough market move will thus trigger all insurers to trade simultaneously, regardless of the specific parameters of their insurance policies.”17
Portfolio insurance was a product that was intended to reduce risk. In this early form of program trading, a computer program automatically forced the portfolio to sell certain amounts of stock when the markets declined, theoretically reducing the risk exposure of institutional investors.
However, in a classic fallacy of composition, when too many firms line up on the sell side of the trade, liquidity dries up in an instant. As everyone simultaneously rushes for the exit, prices plummet. And, the leverage created by low margin requirements exacerbates the decline. Jacobs states:
“After the crash, the SEC concluded: ‘Low margins…contribute to the illusion of almost unlimited liquidity in the futures market. During a market break, however, that liquidity disappears at a rate geometrically larger than liquidity in the lower leveraged stock market.’ The Brady Commission [a task force headed by Reagan’s Treasury Secretary, Nicholas Brady] finds that the equity and futures markets during the crash were simply incapable of bearing ‘the full weight of the estimated $25 billion of selling dictated by portfolio insurance strategies.’ This volume translates into about four days’ worth of average trading volume on the NYSE at the time. According to the Brady Commission, ‘the selling pressure in the futures market washed across to the stock market.’” 18
Now compare Dr. Jacobs’s comments to those of Wikipedia regarding the term “liquidity risk.”
“Liquidity risk arises from situations in which a party interested in trading an asset cannot do it because nobody in the market wants to trade that asset. Liquidity risk becomes particularly important to parties who are about to hold or currently hold assets, since it affects their ability to trade.” 19
Notice the parallels between what causes a liquidity crisis, and what took place in October of 1987. For those who would like to read further on the size and scope of one of our most heavily leveraged markets today, I offer Burkhard Vanholt’s 1994 critical appraisal of six industry reports on financial derivatives. In reading this, we note the distinct possibility of another liquidity crisis. Indeed, liquidity crisis could be the very reason that the Federal Reserve removed the reporting of M3 in March of this year.
Wikipedia’s definition continues with a discussion of the possibility of selling in one market culminating in selling pressure in other markets – a sort of domino effect.
“Liquidity risk tends to compound other risks. Suppose a firm has offsetting cash flows with two different counterparties on a given day. If the counterparty that owes it a payment defaults, the firm will have to raise cash from other sources to make its payment. Should it be unable to do so, it too would default.” 20
The September 2006 IMF, Global Stability Report revealed that, at the end of 2005, the worldwide notional value of over the counter (OTC) derivatives contracts stood at $284 trillion, up $84 trillion over the last two years. Bond markets stood at $59 trillion, up $7 trillion, and stock markets stood at $37 trillion, up $6 trillion over the same time period. The sheer size of the OTC derivatives market dwarfs the bond market, the stock market, our nation’s annual GDP, and even our nation’s debts.
As various risks from various players cross various markets, a ripple effect could occur, and the Poseidon could be capsized by a rogue wave. Again, Wikipedia notes:
“Accordingly, liquidity risk has to be managed in addition to market, credit, and other risks. Because of its tendency to compound other risks, it is difficult or impossible to isolate liquidity risk. In all but the most simple of circumstances [an ideal academic environment only], comprehensive metrics of liquidity risk don’t exist.” (Brackets mine) 21
Vanholt states, “Regulators are primarily concerned about systemic implications of liquidity risk.” In other words, regulators understand the importance of trying to prepare for a clustering of trades on one side of the markets, which could lead to a historic occurrence. And yet, because central banks wield such power in our fiat currency system, regulators are ill equipped to stop this runaway train.
The World In Chaos
Part of our lack of preparation for such events comes from our cultural practices. Namely, we do not like to look at anything negative, and we are only taught to think along linear lines. A client of mine once asked, “How can you look at all this negative stuff?” While I have ethical reasons for doing so, I know that the more I study the investment markets, and the things that affect them, the more I know about our current juncture. Understanding where we are and where we have been, helps me anticipate and navigate our course. To make better investment decisions, the other obstacle that we must overcome is linear thinking. Of course this starts with our own education. Our basic education is confined to linear thought – the most obvious subjects being linear algebra, linear equations, and Euclidian geometry. This occurs in many other subjects where we study cause-and-effect relationships, some of which are true.
We carry this into our personal and business practices as well. Indeed, many self-help books are written and read because we think in linear terms. That is, if we do X, then Y will happen. And of course this is true in a probabilistic sense, but it is never guaranteed, as we subconsciously believe that it is. For example, we read The Seven Steps to Financial Freedom, and, however imperfectly, we actually employ the said seven steps. What usually happens? It doesn’t go according to plan. There’s a hitch. We go around it, and the knowledge later proves useful in an ancillary way. In business, linear thinking goes by the term “the bottom line.” The business environment doesn’t support curiosity and exploration. Most firms do not allow employees to spend time on any issue, unless they are sure that the answer will come quickly and will increase profitability.
As we grow older, we realize that life is more like the fractals we studied in last month’s newsletter. Events in the markets and in our lives rarely follow a continuous path of absolute certainty. However, if we step back and look at the big picture, we see… patterns. In the midst of a world that appears to be without order, closer investigation reveals cyclicality. This is the basic thought behind the science and math that has come to be known as Chaos Theory.
In his book, Trend Following, Michael Covel articulates the problem with linear explanations.
“The only systems that could be understood in the past were those that were believed to be linear, that is to say, systems that follow predictable patterns and arrangements. However, the problem arises that we humans do not live in an even remotely linear world; in fact, our worlds must indeed be categorized as nonlinear; hence, proportion and linearity is scarce.” 22
Taleb notes, “Chaos theory concerns itself primarily with functions in which a small input can lead to a disproportionate response.” 23 Mandelbrot adds, “The most famous example of chaos was proposed by meteorologist Edward Lorenz in 1972: [with the question] can the flap of a butterfly’s wings in Brazil set off a tornado in Texas?” 24
Of course all of this means nothing to the investor unless such occurrences can be seen in the markets. In his book, Fractals, Chaos, Power Laws: Minutes from an Infinite Paradise, Manfred Schroeder states:
“One of the neighborhoods where power-law noises dominate the scene, and chaos reigns the charts, is Wall Street, U.S.A. At stock and commodity exchanges, self-similarity weighs in on many scales.” 25
So, what is the benefit of knowing this information? In our current market environment, it could prove to be crucial to the survival of the investor or manager. Again, Covel points out that the most successful money managers are those that embrace and utilize the concepts of chaos theory. He states:
“While acceptance of a nonlinear world is a new concept for most, it is not a new proposition for trend followers. Big events are nonlinear events. Trend followers won those events because they expected the unexpected. Lack of linearity, or cause and effect, was not something they feared because their trading models were built for the unexpected.” 26 (Italics mine)
The idea of looking for the rare event is also found in the trading practices of Nassim Taleb. In his book, Fooled By Randomness, Taleb states:
“One such rare event is the stock market crash of 1987, which made me as a trader and allowed me the luxury of becoming involved in all manner of scholarship. Nero [another trader] aims to get out of harm’s way by avoiding exposure to rare events – a mostly defensive approach. I am far more aggressive than Nero and go one step further; I have organized my career and business in such a way as to be able o benefit from them [rare events]. In other words, I aim at profiting from the rare event, with my asymmetric bets.” 27
Taleb continues:
“In the markets, there is a category of traders who are inverse rare events, for whom volatility is often a bearer of good news. These traders lose money frequently, but in small amounts, and make money rarely, but in large amounts. I call them crisis hunters. I am happy to be one of them.” 28
But rather than attempting to hire a “trend follower,” we would do better to focus on understanding why we must anticipate and accommodate rare events. There are times when the markets appear directionless, but they inevitably unfold in patterns similar to those of the past. The markets, like nature, appear chaotic to the glances of the linear eye. Yet, more careful observation reveals symmetry and order in the midst of what was perceived to be chaos. Schroeder paints the picture well.
“The unifying concept underlying fractals, chaos, and power laws is self-similarity. Self-similarity, or invariance against changes in scale and size, is an attribute of many laws of nature and innumerable phenomena in the world around us. Self-similarity is, in fact, one of the decisive symmetries that shape our universe and our efforts to comprehend it.
Symmetry itself is one of the most fundamental and fruitful concepts of human thought. By symmetry we mean an invariance against change: something stays the same, in spite of some potentially consequential alteration.” 29
Like Dr. Mandelbrot, Dr. Schroeder points out, “Nature abounds with periodic phenomena: from the motion of a swing to the oscillations of atoms, from the chirping of a grasshopper to the orbits of the heavenly bodies.” 30 Though nothing is exactly periodic, order can still be seen. The fact that a cloud covers our sunrise or that the wind isn’t blowing today doesn’t mean that there is no sun or that the wind will never blow again.
History shows that nature, economies, and markets often display a type of deterministic chaos. Schroeder states:
“No matter how chaotic life gets, with all regularity gone to bits, another fundamental bulwark often remains unshaken, rising above the turbulent chaos: self-similarity, an invariance with respect to scaling; in short, a self-similar object appears unchanged after increasing or shrinking its size. Indeed, in turbulent flows, large eddies beget smaller ones; and these spawn smaller ones still.” 31
A Landslide in a Teacup
Because we extrapolate linear thoughts, millions of investors and advisors are not prepared for what lies ahead in our markets. They’re thinking something like, “As long as we keep dollar-cost-averaging our diversified portfolio, then we’ll have plenty of money when retirement comes. If it’s worked for the last 25 years, why fix it? Right?” And yet, the history of the markets, general history, and science and math are telling a different story.
Once the markets have reacted to the myriad factors foretelling price swings well beyond the standard deviations, many will have to live with the thought that they suspected something was amiss but took no action and suffered catastrophic losses.
We close this month’s newsletter with a poignant scientific experiment that could prove pertinent to our markets. As an aside, this illustration also demonstrates how crowds react once they understand that they have been misled. At some point, we must address the enormous, unspoken risk of unethical behavior in our markets and our economy. I am certain you will see the similarities. In his book, The Wave Principle of Human Social Behavior, Prechter conveys the following:
“In studying sand piles, Bak and Chen found a phenomenon that I would characterize as very like herding behavior. Their machine dropped single grains of sand at regular intervals. A pile shaped roughly like a cone quickly developed. Then, at seemingly unpredictable times, a single grain added to the pile produced a slide of many grains down the side of the cone. As sand was added, the cone continued to grow. Landslides continued, and their sizes varied. Upon occasion, a particularly large slide occurred. Here is their summary of this behavior:
‘At criticality, the size of the landslide does not depend on the size or the number of new grains added. It depends on the holistic behavior of all the grains acting together. The global behavior of the total pile transcends the behavior of the individual grains within it. At criticality, every grain is interacting in complex ways with all its neighbors. The motion of one grain on the slope can induce motion in thousands of others.’” 32
Again, very small additional inputs can cause disproportionate results. As such, we shouldn’t be looking for the big event to topple our sandcastle, but rather the small occurrence that sets off a chain reaction.
If you know people who, unlike you, have yet to start learning about the casino we depend on, I encourage you to share this article, and those like it, with them. The months ahead will prove extremely painful to those who’ve buried their heads in the sand. Best Minds Inc gleans ideas from a wide range of topics and experts. To improve our odds of profiting during this time of great deception and confusion, we look at history against the action of financial markets, in a “connect-the-dots” format. If you are interested in our research, consider our publication, The Investor's Mind: Anticipating Trends through the Lens of History.
Sources:
- Fooled by Randomness: The Hidden Role of Chance in the Markets and in Life (2001) Nassim Taleb, page 10
- Money and The Mind: Borrowing and Lending in America From the Civil War to Michael Milken (1992) James Grant, page 169
- Ibid, page 170
- Ibid
- The (Mis)Behavior of Markets: A Fractal View of Risk, Ruin, and Reward (2004) Dr. Benoit Mandelbrot and Richard Hudson, pages 173-176
- Ibid- pages 177-178
- Ibid- page 178
- Ibid- page 180
- Ibid- pages148-149
- Ibid- page 180
- Ibid- page199
- Ibid- page 201
- http://www.nature.com/nature/debates/earthquake/equake_contents.html
- Ibid
- The (Mis)Behavior of Markets, Mandelbrot and Hudson, page 13
- http://en.wikipedia.org/wiki/Fat_tail
- Capital Ideas and Market ReWikipedia.org/wiki/Liquidity_riskalities: Option Replication, Investor Behavior, and Stock Market Crashes, (1999) Dr. Bruce E. Jacobs, page 145
- Ibid- page 145
- Ibid
- Ibid
- Trend Following: How Great Traders Make Millions in Up or Down Markets (2006) Michael W. Covel, page 192
- Fooled by Randomness, Taleb, page 143
- The (Mis)Behavior of Markets, Mandelbrot and Hudson, page 294
- Fractals, Chaos, and Power Laws: Minutes from an Infinite Paradise (1991) Dr. Manfred Schroeder, page 126
- Trend Following, Covel, page 192
- Fooled by Randomness, Taleb, page 90
- Fooled by Randomness, Taleb, page 96
- Fractals, Chaos, Power Laws, Dr. Manuel Schroeder, page xiii
- Ibid- page1
- Ibid- pages 1-2
- The Wave Principle of Human Social Behavior and the New Science of Socionomics (1999), Robert R. Prechter Jr., pages 421-422
By Doug Wakefield with Ben Hill
President
Best Minds Inc. , A Registered Investment Advisor
3010 LBJ Freeway
Suite 950
Dallas , Texas 75234
doug@bestmindsinc.com
phone - (972) 488 -3080
alt - (800) 488 -2084
fax - (972) 488 -3079
Copyright © 2005-2010 Best Minds Inc.
Best Minds, Inc is a registered investment advisor that looks to the best minds in the world of finance and economics to seek a direction for our clients. To be a true advocate to our clients, we have found it necessary to go well beyond the norms in financial planning today. We are avid readers. In our study of the markets, we research general history, financial and economic history, fundamental and technical analysis, and mass and individual psychology.
Disclaimer: Nothing in this communiqué should be construed as advice to buy, sell, hold, or sell short. The safest action is to constantly increase one's knowledge of the money game. To accept the conventional wisdom about the world of money, without a thorough examination of how that "wisdom" has stood over time, is to take unnecessary risk. Best Minds, Inc. seeks advice from a wide variety of individuals, and at any time may or may not agree with those individual's advice. Challenging one's thinking is the only way to come to firm conclusions.
Doug Wakefield Archive |
© 2005-2022 http://www.MarketOracle.co.uk - The Market Oracle is a FREE Daily Financial Markets Analysis & Forecasting online publication.