


Japanese Deflation... A Global Liquidity Wild Card
Stock-Markets / Liquidity Bubble Aug 06, 2007 - 08:19 PM GMTBy: John_Mauldin

This week in Outside the Box we turn our eyes on Japan and as promised offer a report by macro-maven and good friend Greg Weldon. Japan is the world's second largest economy and a major source of liquidity. While China has captured the headlines in Asia, Japan is still the big economic dog and supplier of capital on the block.
Greg argues that there is the potential for another asset bubble popping in Japan at the same time as we see our housing market and subprime mortgages implode. That could have considerable implications for world wide liquidity and the yen carry trade.
While this prints out longer than usual, it is mostly charts, as Greg likes to illustrate his thinking with lots of graphs. Follow his logic and reasoning. He is pointing out a potential problem that no one else I know is paying attention to. At the end is an offer for a trial subscription to his work, which I find quite valuable... John Mauldin, Editor
MACRO-GLOBAL: Japanese Deflation...
A Liquidity Wild Card
by Greg Weldon
Does anyone remember ... Japan ??? Does anyone remember ... that Japan suffers from overt price deflation?
Until now, Japan had been 'floated' by ASSET reflation. That has included 'Land', and thus Real Estate. Interestingly, and SO a symptom of the monetary angle on reflation, we note that Real-Estate and Land have FAR, FAR, FAR 'outperformed' the Construction and Building sectors.
The BOOM has NOT been via a supply build-out. It is defined purely as monetarily-driven asset price reflation. Whoops, there is a problem !!!! The BOOM in Land and Real-Estate, along to a lesser extent in stock market wealth ... has NOT resulted in ANY of the following effects:
- Rising Domestic Consumer Spending
- Expanding Monetary Base
- Consumer Price Inflation
NONE of the above need concern the Bank of Japan (BOJ).
Indeed, rather, CPI has re-accelerated to the DOWNSIDE, as evidenced by the most up-to-date July Tokyo-area figures released last Friday, revealing the following data-dissected details:
Core CPI ... deflated (-) 0.1% for the month, and remains in overt deflation on a year-year basis for the last two months in a row, pegged at minus (-) 0.1%
Headline CPI ... the actual index has deflated by a half-percentage point in just the last two months, falling from 100.4 in May, to July's reading of 99.9. The year-year rate also posted its second straight deflationary reading, pegged at minus (-) .01%.
Perhaps DEFLATION in Retail Sales (ie: demand) is resulting in downside pricing pressure from a competitive standpoint on the supply side. Indeed, the scalpel exposes the following reality within Japan's June Retail Sales figures, also released last Friday:
Retail Sales ... down (-) 0.8% for the month, taking the year-year rate into overt deflation, pegged at minus (-) 0.4% yr-yr, sliding from May's barely positive growth of plus + 0.1% yr-yr.
Wholesale Sales ... down (-) 1.9% in June, a sizable single-month decline that caused the year-year sales pace to slow significantly, to plus +5.3%, down from +7.7% yr-yr in May.
While there is credible focus on job creation and low unemployment, there is still NO spending growth, not even within the labor market derived data released yesterday morning, revealing ...
Average Household Spending ... 280,587 yen in June, a LOW single-month figure relative to the recent string of figures above 300,000 yen, and, down by more than 12,000 yen (monthly) from May's punk sub-300K spending figure of 293,231 yen. Subsequently, the year-year rate remains in overt DEFLATIONARY territory for the second month running, at minus (-) 0.2% yr-yr.
Does it take a rocket scientist to make the connection between the data spotlighted above, and the data offering detailed below ???
Japan Gasoline, Average Retail Pump Price ... 141.3 yen per liter as of the week of July-23, a NEW HIGH, rising from 140.6 two-weeks previous, and 138.9 yen per liter four weeks ago, and up significantly from 136.8 as of the end-May. In total, it's a +3.2% nominal increase in seven weeks.
GEE, no wonder the LDP got booted from their 'ruling' Upper House majority during this past weekend's elections, which vaulted the opposition Democratic Party into 'power', and threatens to bring down Prime Minister Abe.
We note the COMPLETE LACK of monetary impetus, via the Monetary Base data released this morning by the Bank of Japan:
Monetary Base ... CONTRACTED by (-) 301 billion yen during July, ending the month at Y88.213 trillion yen, down from end-June's total of Y88.515 trillion yen. Thus the year-year rate remains in negative territory and the Monetary Base continues to contract, with July's decline pegged at (-) 2.3% yr-yr.
Of interest within the breakdown of aggregate supply components we note:
Current Account Balances ... expanded by 2.05 trillion yen in July, a HUGE single-month increase equal to +2.4% nominally.
Bank Notes in Circulation ... rose by 6.4 trillion yen in July
Indeed, we juxtapose the cumulative expansion in these two components is 8.5 trillion, relative to a decline in the Monetary Base of (-) 300 billion yen, and we MUST ask ... MMMMmmm, might this money have found a way into the ASSET markets ??
Evidence the following data-nugget extracted from a recent UBS report:
Japanese Retail Margin Trading Accounts in FX ... RECORD monthly increase posted for the month of June, capping a +100% volume increase since the beginning of the year.
Indeed, according to UBS ... RETAIL trading now accounts for ONE-FOURTH of ALL foreign exchange trading executed daily in Tokyo.
WOW, we can only begin to imagine what this factoid might imply for the value of the Japanese Yen, and the impact on global liquidity, if domestic retail speculators began to aggressively go long the domestic currency !!!!
To date the reflation in asset prices, along with expansion in exports, particularly to China (note how weak the Yen has been against the Yuan, as USD-JPY rallies, and USD-CNY declines) ... HAS been reflected by expanding Industrial Production and robust readings in the Manufacturing Purchasing Manager's Survey results.
Until now that is.
Note yesterday's Japanese PMI Survey results:
Headline PMI ... 49.0 ... below fifty for the first month in over FOUR YEARS ... falling from 50.4 in June, down from 51.4 in May, and significantly lower in just four months from the 52.3 seen in April.
Output Index ... 48.1 ... PLUNGING from 54.2 just four months ago, in April, and sliding below fifty from the 50.8 seen in June.
Backlog of Orders ... down to just 45.8
Finished Goods Inventories ... 52.0 ... rising in line with building inventories of consumer goods, up sharply from the sub-fifty (inventories contracting) reading of 49.5 posted in June.
Even the one area of strength in the data deluge unleashed over the last week, the labor market, we note serious PMI slippage:
Employment ... 51.4 ... ala a sizable single-month decline from 53.2
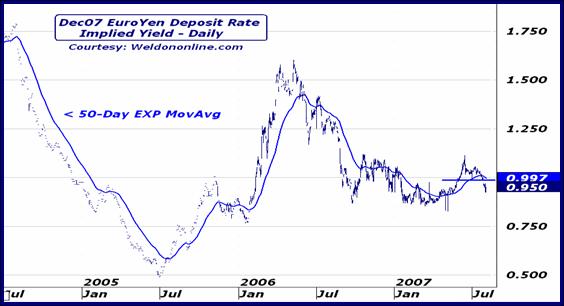
Surprise NOT then, expectations for the second-half of 2007 as they relate to potential changes in BOJ monetary policy ... are diminishing ... as evidenced in the chart on display below. Note that the year-end Dec-07 Deposit Rate contract has removed 50 basis points of TIGHTENING via BOJ rate HIKES, that it had priced as recently as the end of last year, and is heading back below 1% currently, via a gap-down and run move this week.
MOST interesting is the 'confirmation' that is suddenly becoming more 'solid' within the foreign exchange defined 'Swap' markets, as noted in the pair of charts on display below.
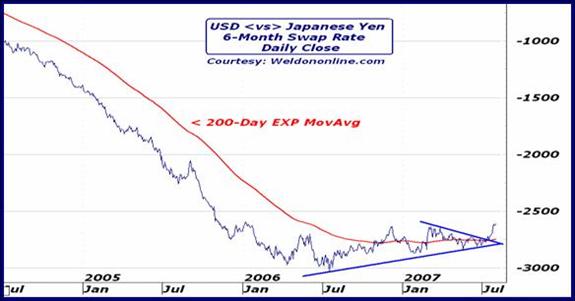
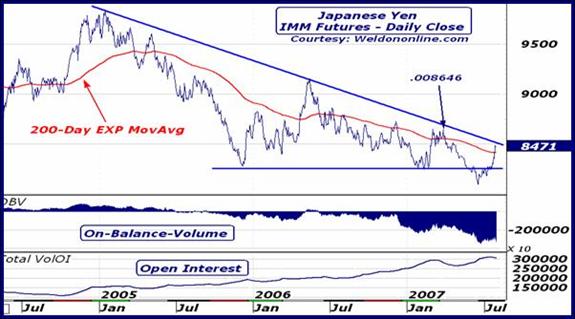
In the daily chart below we plot the Dollar-Yen 6-Month Swap Rate, a proxy for the near-term interest rate differential between the two countries. Clearly, through 2005 and 2006 the trend was towards an expanding Japanese interest rate 'discount', driven by Fed rate hikes.
Now the trend has reversed, and with Japanese short-rate hike expectations receding, their interest rate 'discount' is narrowing, as US rate hike expectations recede more quickly amid hope for an easing in policy.
The breakout would seem to be Yen 'supportive' at the margin, a margin that has NOT 'existed' for at least two years. Technically we evidence the directional upside reversal in the trend defining 200-Day EXP-MA.
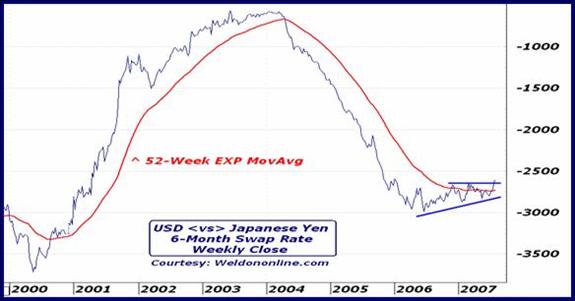
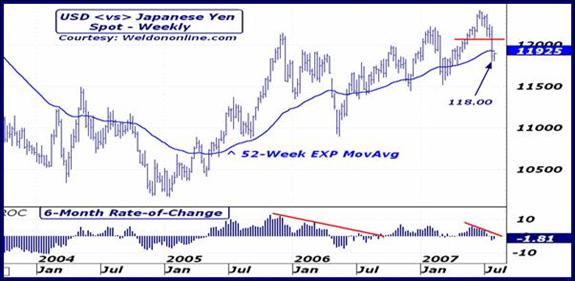
Observe the trend reversal from the longer-term weekly perspective, and as defined by the 52-Week EXP-MA and wedge-bottom pattern.
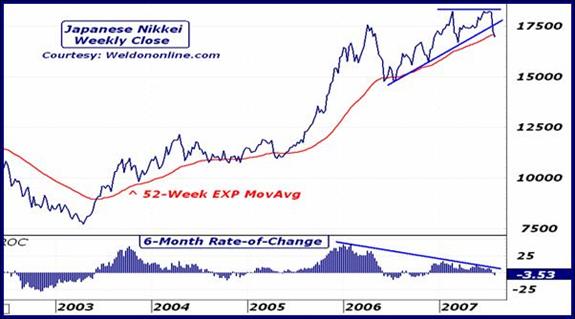
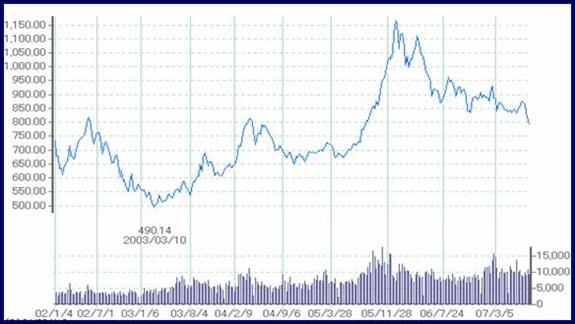
In the context of a trend change in the fixed-income dynamic, and a potential shift in the currency influence (see yesterday's technical dissection applied to the Japanese Yen) ... we next note the Nikkei, a pending breakdown, and potential topping pattern.
Evidence the weekly close-only chart on display below, replete with downside violation of the long-term 52-Week EXP-MA, and the slide into negative, ASSET PRICE DEFLATION DEFINING, territory by the 6-Month ROC, following a prolonged period of EXTREME 'bearish divergence'.
MOST TROUBLING OF ALL ...
... is the fact that, TODAY, Japanese bank share prices BROKE DOWN.
Moreover, they broke down to MULTI-YEAR LOWS, and did so on the back of DISINFLATING profits, such as the (-) 31% decline in profits reported by banking behemoth Mitsubishi UFJ, and the (-) 50% decline posted by Mizuho.
Oh, and by the way, lest one thinks this matters not ... Mitsubishi UFJ is the WORLD'S SINGLE LARGEST BANK, while Mizuho is Japan's second largest !!
Oh, and by the way, shares of Mizuho PLUNGED by (-) 9% this morning, leading the TOPIX Bank Index down by nearly (-) 5% to its lowest level in almost THREE YEARS.
Indeed, a trend reversal capped off by a huge decline to new multi-year lows in Japanese banks ...
... a move that CLEARLY ... has NOTHING to do ... with the tightening in domestic US credit conditions sparked by the sub-prime–mortgage debacle ...
... MUST be 'respected' in terms of its potential macro-message.
In short, that macro-message is one of INTENSIFIED liquidity tightening, and the prospect of a broader, global, tightening in credit conditions.
Wow, monetary base deflation, retail sales deflation, price deflation ...
... and bank share price deflation ???
Can this be ignored, in what is still the world's second largest economy ???
Can it be coincidence BOTH of the largest economies are now trending in the same direction, amid a narrowing in the Swap Rates and diminished forward policy tightening expectations ???
Can the Yen and the Dollar ... rise together ???
Again, such would reflect an intensifying evolution towards a 'worse-case-scenario', in terms of liquidity and credit conditions tightening.
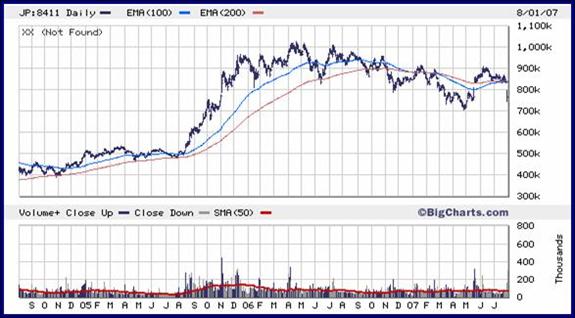
Evidence the technical damage in the banking shares, starting with the plunge in Mizuho Financial Group exhibited in the daily chart below. Note the gap-down-and-run move today, executed on HIGH volume.
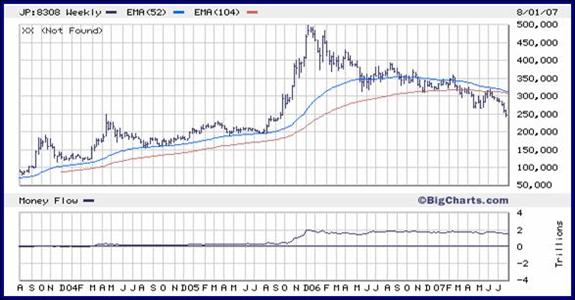
Observe Resona in the weekly chart below, reflecting a technical breakdown and bearish moving average crossover, as the 52-Week EXP-MA crosses below the 2-Year EXP-MA, with BOTH averages declining.
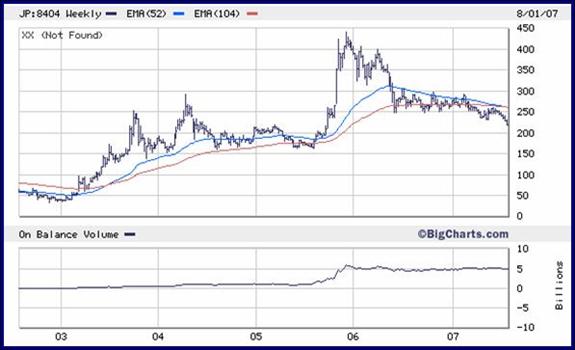
Note Mizuho Trust, and a similar technical breakdown to that seen in Resona, defined by a bearish MA crossover and multi-year price low. Worse yet we observe that the On-Balance-Volume indicator implies virtually NO long-liquidation, yet.
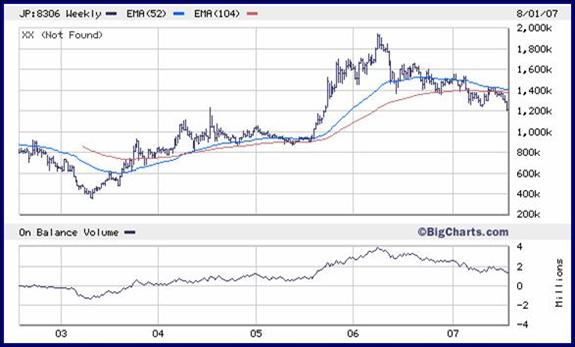
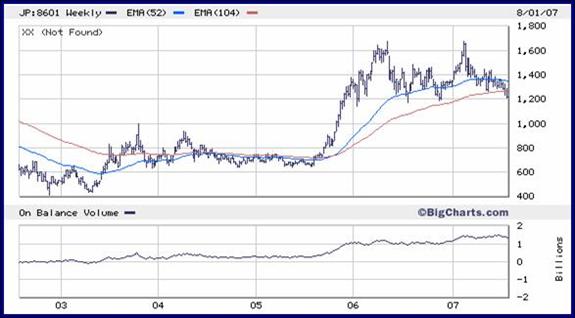
Same song-and-downside-dance is evident in the weekly chart of the world's LARGEST BANK, Mitsubishi UFJ, on display below. Note the bearish moving average dynamic and breakdown to new lows in price.
Worse yet ... note the near FORTY-PERCENT DEFLATION in price since it peaked above 1,900 yen per share early last year. Yes, the world's largest bank's 'asset-value' has deflated by almost (-) 40% in the last 18 months.
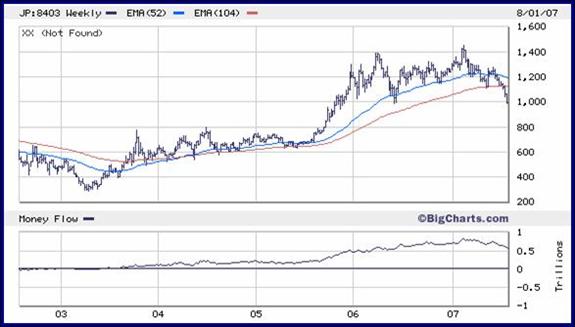
Under big downside price pressure today was Sumitomo Trust, seen in the long-term weekly chart on display below. Indeed, today's breakdown below 1,000 yen per share completes the VIOLATION of an uptrend in place since 2003, and takes the decline since this year's peak to almost (-) 30%.
Troubling is the LACK of liquidation implied by the Money Flow indicator, given a six-month price deflation equal to almost ONE-THIRD of its value.
Given the eerie similarities to the breakdown in US bank shares, seen in the charts above ... we MUST also shine the spotlight on the chart below, in which we note the breakdown and trend-reversal taking place in Japanese brokerage behemoth Daiwa Securities.
Folks ... the Japanese financial sector is BREAKING DOWN ... just like the US financial sector, meaning both of the world's largest banking sectors are reversing into a trend towards price deflation, at the SAME TIME !!!
This CANNOT be 'ignored', yet we hear FEW people talking about Japan.
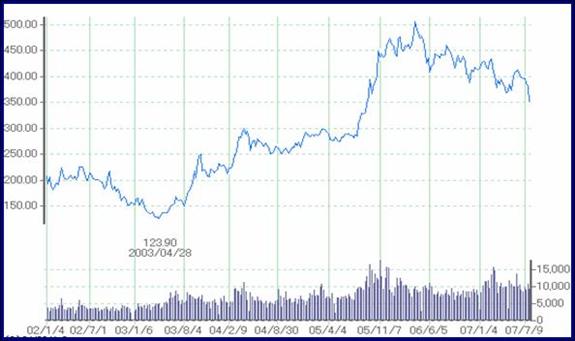
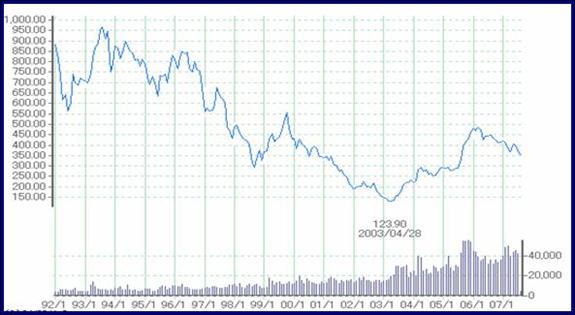
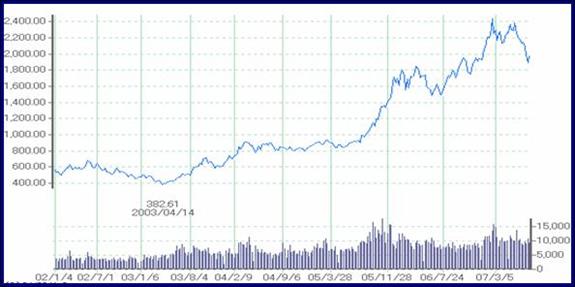
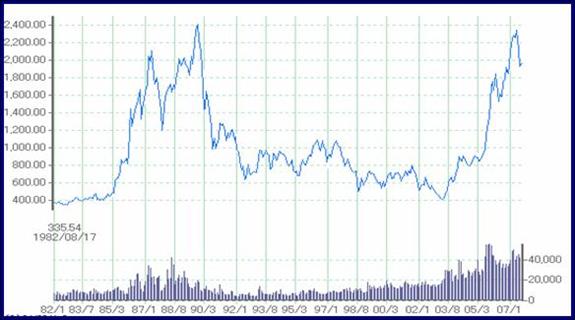
Observe the price action in the TOPIX Bank Sector Index as evidenced in the pair of charts on display below coming courtesy of the Tokyo Stock Exchange, and their web site.
First, the daily chart dating back five years reveals a well-defined technical breakdown, with violation of the uptrend since 2003, and plunge to new lows on HUGE volume.
From the longer-term 15-year weekly perspective shown in the chart exhibited below, we note the feeble corrective rally since 2003, as it compares to the deep bear market experienced during the nineties, a decade defined by Japanese deflation and contraction in bank lending.
On the flip-side we note the UPSIDE BLOW OUT in Japanese Land Prices during 2006, as reported this morning, led by a +17% reflation in Tokyo prices, driving an increase of +8.6% in the nationwide Average Land Price, the second straight increase following 14 straight years of decline.
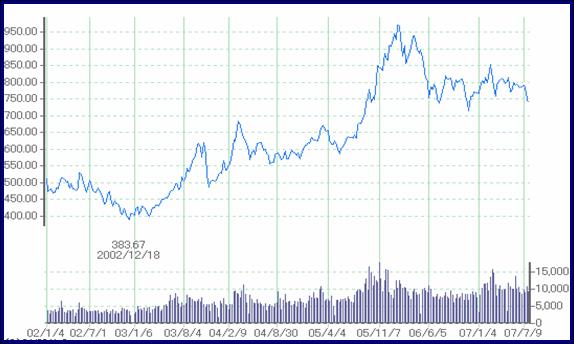
HOWEVER ... property share prices have already turned to the downside, today's news-based jump notwithstanding, as evidenced in the pair of charts on display below in which we plot the TOPIX Real-Estate Sector Index.
Like banks and brokers ... the property stocks have cracked open on BIG volume, and threaten to violate the uptrend in place since 2004, as exhibited in the daily chart seen first.
More interestingly, when we turn to the long-term weekly chart shown below, we note a MAJOR double-top developing from a secular perspective, with the recently set price peak just below the all-time peak posted in the BUBBLE period of the late eighties.
We MUST ask, has ANOTHER secular BUBBLE been POPPED, on BIG volume ??
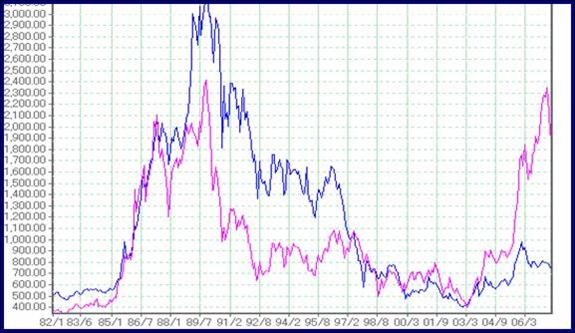
Of specific secular interest is the SEVERE gap noted in the long-term, 25-Year long weekly chart on display below, in which we plot the TOPIX Real-Estate Sector Index (property shares) against the TOPIX Construction-Building Sector Index. Indeed, the latter has completely FAILED to 'participate' in the current bubble, amid PURE monetary policy induced land price reflation, as opposed to an infrastructure or residential property boom, which was virtually NON-EXISTENT.
With that in mind, we note the teetering in the TOPIC Construction-Building Sector Index, exhibited in the daily chart shown below, as volume surges and the index threatens to breakdown and violate its feeble uptrend.
This helps explain a fundamental difference between the Japanese asset price reflation, and its LACK of spill-over into domestic consumer spending growth ... relative to the frenzied consumption scene in the US since 2001.
This makes the breakdown in the TOPIX Retail Sector Index, seen in the daily chart on display below, all the more 'troubling' from a macro-perspective.
At the very least, this chart view offers CONCRETE support for belief in the macro-evolution evidenced in the Household Consumption and Retail Sales data we dissected earlier in today's Monitor.
It is a HIGH VOLUME breakdown and trend reversal ...
... not only in the Japanese Retail sector ...
... but also the Property sector, and the Construction-Building sector ...
... along with the Banking sector and the Brokerage sector.
Which means ... Japan and the US are BOTH experiencing equity asset value DEFLATION at the same time.
Systemic risk is REAL, and that risk is FAR from 'contained' within the US subprime mortgage arena.
We continue to look for Yen strength, and note the 118 level as a downside 'accelerant-trigger' for USD-JPY, a move that should follow suit given the trend reversal noted in the Swap Rate market, and the parallel erosion in retail-consumer and financial sectors in both the US and Japan.
Note the chart of the Japanese Yen futures contract on display below, as the yen is pushing towards a potential upside breakout, trend violation, and reversal ... against a LARGE 'short' position defined by the OBV and Open Interest figures generated when the Yen fell to a new low in June.
As for macro-backdrop in Japan, we spotlight the lopsided loss suffered by Prime Minister Abe's ruling LDP Party over the weekend, where they lost their majority in the Upper House of Japan's Parliament. Moreover, calls for Abe's registration are intensifying following the latest poll revealing a NEW LOW in his 'rating', which plunged to 30% against a backdrop dominated by the rise to power by the opposition Democratic Party.
Indeed, the Democratic Party has pledged to END the LDP's tight fiscal policy, and avoid ANY hikes in consumption and income taxes that had been proposed by the LDP.
This might be the catalyst to solidify a potential trend reversal in the Yen, one that might actually exacerbate the tightening in US credit conditions, if not global liquidity as the yen-carry-trade might come under pressure.
A move below 118 in Dollar-Yen would be a sign, as defined in the technical overview on display within the longer-term weekly chart seen below.
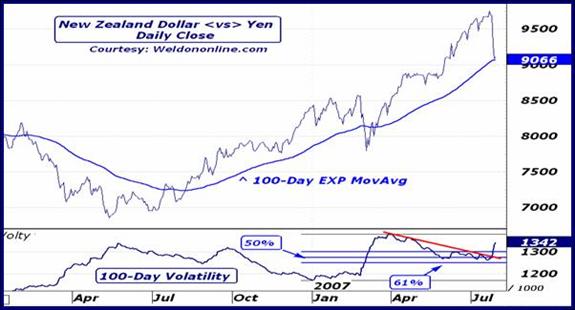
Note the yen-carry-liquidation 'symptomatic' move taking place in the Kiwi-Yen cross-rate, exhibited in the chart below, amid the upside trend acceleration in Volatility, the hallmark of a liquidation push.
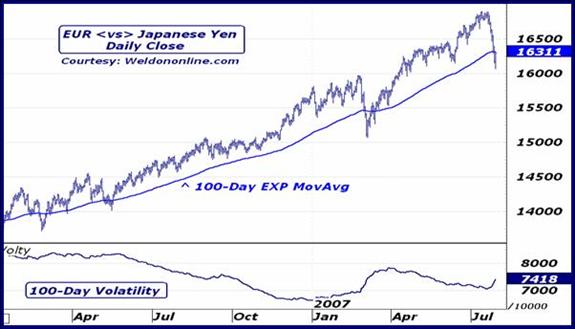
Similarly, we are focused on the action in EUR-JPY, plotted in the daily chart below replete with downside violation of the med-term 100-Day EXP-MA, and, more importantly, a renewed rise in the med-term Volatility indicator.
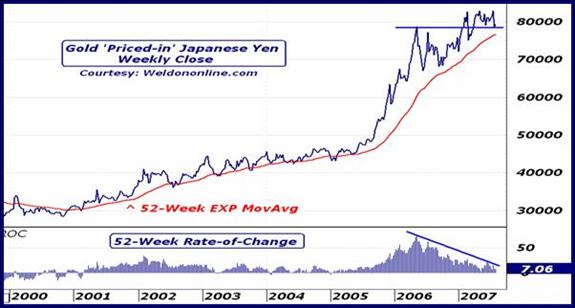
More subtle is the potential for a breakdown in the price of Gold, 'denominated' in the Japanese currency, as noted in the long-term weekly chart on display below. Observe the severe momentum divergence implied by the failure of the 52-Week ROC to confirm the new price high. A violation of the uptrend defining 52-Week EXP-MA would be MOST interesting, and would serve to solidify our expanding desire to be long the yen.
Indeed, a move below 118 in USD-JPY, in line with an extending decline in EUR-JPY, a breakdown in the price of Gold denominated in Yen, and continued plunge in Kiwi-Yen ...
... along with further disinflation in the Aussie Dollar versus the Yen ...
... would also further solidify our bearishness in US stock indexes.
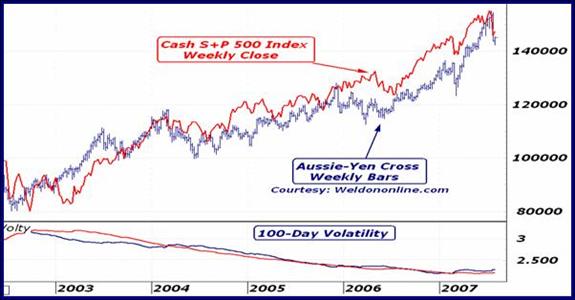
Indeed, we shine the spotlight on our final chart of the day, seen below, in which we plot the Aussie-Yen cross-rate against the US S+P 500 Index, via the weekly overlay perspective.
Not only is this a clear case of 'positive-correlation' ... but even more intriguing is the TIGHT correlation in the long-term Volatility readings, both of which are ticking to the upside and threatening to violate a multi-year downtrend ... amid a simultaneous downside price plunge in both the AUD-JPY and S+P.
Deflation is taking hold again in Japan ...
... while wealth disinflation is becoming more acute in the US stock market.
It is NOT coincidence that BOTH ... Japanese AND US bank shares, brokerage shares, and consumer-retail sector funds are LEADING the global markets LOWER.
This is a MAJOR macro-message being sent to investors around the world.
A move in USD-JPY below 118 might just cause the next shoe to drop.
Expect it.
For readers of John Mauldin's "Outside the Box" commentary, we are offering a FREE trial subscription to our research publications. Visit our website at Weldononline.com and sign up today.
Also, check out Greg Weldon's book, "Gold Trading Boot Camp: Master the Basics and Become a Successful Commodities Investor", available at amazon.com , weldononline.com .
Gregory T. Weldon
www.Weldononline.com
Your hoping two asset bubbles don't pop at once analyst,
By John Mauldin
http://www.investorsinsight.com
To subscribe to John Mauldin's E-Letter please click here: http://www.frontlinethoughts.com/subscribe.asp
Copyright 2007 John Mauldin. All Rights Reserved
John Mauldin is president of Millennium Wave Advisors, LLC, a registered investment advisor. All material presented herein is believed to be reliable but we cannot attest to its accuracy. Investment recommendations may change and readers are urged to check with their investment counselors before making any investment decisions. Opinions expressed in these reports may change without prior notice. John Mauldin and/or the staff at Millennium Wave Advisors, LLC may or may not have investments in any funds cited above. Mauldin can be reached at 800-829-7273.
Disclaimer PAST RESULTS ARE NOT INDICATIVE OF FUTURE RESULTS. THERE IS RISK OF LOSS AS WELL AS THE OPPORTUNITY FOR GAIN WHEN INVESTING IN MANAGED FUNDS. WHEN CONSIDERING ALTERNATIVE INVESTMENTS, INCLUDING HEDGE FUNDS, YOU SHOULD CONSIDER VARIOUS RISKS INCLUDING THE FACT THAT SOME PRODUCTS: OFTEN ENGAGE IN LEVERAGING AND OTHER SPECULATIVE INVESTMENT PRACTICES THAT MAY INCREASE THE RISK OF INVESTMENT LOSS, CAN BE ILLIQUID, ARE NOT REQUIRED TO PROVIDE PERIODIC PRICING OR VALUATION INFORMATION TO INVESTORS, MAY INVOLVE COMPLEX TAX STRUCTURES AND DELAYS IN DISTRIBUTING IMPORTANT TAX INFORMATION, ARE NOT SUBJECT TO THE SAME REGULATORY REQUIREMENTS AS MUTUAL FUNDS, OFTEN CHARGE HIGH FEES, AND IN MANY CASES THE UNDERLYING INVESTMENTS ARE NOT TRANSPARENT AND ARE KNOWN ONLY TO THE INVESTMENT MANAGER.
John Mauldin Archive |
© 2005-2022 http://www.MarketOracle.co.uk - The Market Oracle is a FREE Daily Financial Markets Analysis & Forecasting online publication.