


Stock Market Rally Sustainable For Another 2-3 weeks
Stock-Markets / Stock Markets 2010 Mar 14, 2010 - 03:27 PM GMTBy: Andre_Gratian

 Current Position of the Market
Very Long-term trend - Down! The very-long-term cycles have taken over and if they make their lows when
expected, the bear market which started in October 2007 should continue until 2014.
SPX: Long-term trend - Up! We are in a medium-term bull market, which is a corrective move within a long term bear
market. This bull market should last until 2011
SPX: Intermediate trend - The Index continues its uptrend from March 2009. It looks sustainable for another
2 or 3 weeks.
Analysis of the short-term trend is done on a daily basis with the help of hourly charts. It is an important adjunct to the analysis of daily and weekly charts which determines the course of longer market trends.
Daily market analysis of the short term trend is reserved for subscribers. If you would like to sign up for a FREE 4-week trial period of daily comments, please let me know at ajg@cybertrails.com .
Overview:
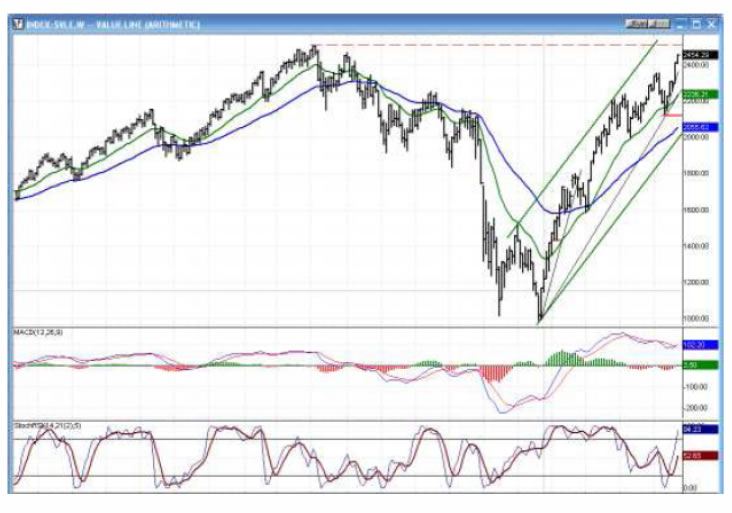
The Weekly chart of the Value Line Index is probably the chart that the bears should have contemplated before declaring a continuation of the bear market. On Friday, the index closed at 2454, within 50 points of its all-time high.
It's unlikely that other indices are going to surpass their October 2007 highs in this market cycle, but they are acting well. All, except the Dow Industrials, have now made recovery highs and appear ready to push higher. However, while the SPX did not look done at 1150, it may be close to reaching its high for this year. There are two cycles which are soon going to interfere with its advance: the 2-year cycle bottoming in July, and the 4-year cycle making its low in the Fall.
A lack of buying enthusiasm has been showing internally in the volume statistics which have been on the low side, but not in the breadth which is still strong, although it is beginning to diverge from price on the Summation index, as we will see later.
Analysis
Chart Pattern and Momentum
First, we look at the Weekly chart. The current trend from March 2009 can be generally defined by an Andrews Pitchfork pattern with the price trading in a narrow range around the median. This will probably change in a few weeks as the current uptrend tops and begins a decline into the 2-yr cycle due in July. How much weakness will be generated by this cycle remains to be seen, and it's possible that the index can hold within the confines of the lower Pitchfork bottom line.
The trend is benefiting from the recent bottoming of the 9-mo cycle to which was added the impetus of the 17-wk cycle three weeks ago. The bottom momentum indicator gave a buy signal in early February and is still rising strongly, telling us that there is no likelihood of a an immediate reversal. But it is lagging the price and starting a pattern of negative divergence which is also reflected in the MACD above.
We'll next look at the Daily Chart. I have toned down all the trend lines which pertain to the Pitchfork in order to emphasize the trend from the March 2009 low. It is represented by green channel lines. The correction from the 1150 high came to an end when it found strong support at the bottom of that channel precisely when it intersected both the long-term downtrend line from the 10/07 high and the 200-D EMA. That point also happened to mark the low of the 9-mo cycle. Since then, the SPX has been in an uptrend, forming a third (and probably final) up-phase from the start of the rally.
The indicators do not show any advanced signs of deterioration in the uptrend, and the price is well above its current uptrend line. However, the index is over-bought short-term and the bottom indicator has given a minor sell signal which could indicate that we are ready for some consolidation.
On the Hourly Chart, I have drawn channel lines around the first and second phases of the uptrend. It is not clear where we go from here on the very short-term, hence, the question mark. The SPX made a new high on Friday, but could not quite close above its former high of 1150.
While the index made a new high, the indicators showed considerable negative divergence. That, and the fact that there was a minor sell signal given by the daily A/D indicator would suggest that there should be a correction before moving higher. We need more clarity and this will come starting with Monday's trading.
There is also some ambiguity about the pattern that the market is making. In the move which started with the 9-mo low at 1040.50, we have two distinct up-phases, and the second phase consists of at least 2 and perhaps 3 separate up-phases. This is what needs to be clarified. If the second phase is complete, then we should have a reversal, come through the bottom channel line, make a consolidation pattern, and continue the uptrend in a third phase. If the second phase is not complete, we should keep moving up within the established channel.
Cycles
In the last newsletter, we were looking for the bottoming of the 17-wk cycle. It made its low on 2/24, about 16 weeks from its former low.
Early next week, the half-span of the 26-td cycle should bottom and could bring us the needed correction.
The next biggie is coming in July as the 2-year cycle low, and when we finish the current up-phase, we could very well decline into that time period.
Then, after that comes the 4-year cycle. That cycle used to bottom like clock work in the Fall, but its last low came around July/August 2006. Perhaps it was the influence of the 2-year cycle which distorted it. We have to be careful not to ignore signs of this happening again this time.
Projections:
There is a good projection to 1192-2004 once the 1150 top is cleared decisively.
Breadth
The NYSE Summation Index (courtesy of StockCharts.com) has rallied from its low and is heading higher. Odds are that it will not make it to its September '09 top, thereby retaining the longer-term negative divergence it developed at its last high. However, it is on par with the SPX for this move and there is no divergence, short-term.
The RSI has reached overbought status, but normally makes more of a top than it has to-date. This also suggests a little more uptrend is ahead.
My daily breadth indicator is showing minor divergence, also probably calling for a near-term consolidation. But it is nothing like that which existed at the 1150 top where we had pronounced double-divergence. This indicates that the uptrend from 1040.50 is unlikely to be over.
Market Leaders and Sentiment
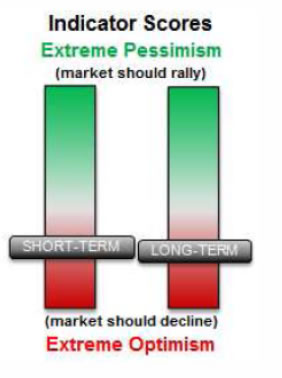
The long-term sentiment indicator condition (below, courtesy of SentimenTrader) continues to deteriorate from bullish near the lows to increasingly negative as we get near the top of the rally.
That indicator, like the others, suggests that we still have a little way to go before we should see red flags.
The short term index confirms the readings of the hourly indicators which are looking for a near-term correction.
Summary
After facilitating a good correction in the uptrend from March '09, the 9-mo cycle bottomed on 2/5 and has pushed prices higher ever since, now being assisted by the 17-wk cycle which made its low on 2/25.
Their combined up-thrust should continue for another two or three weeks. After that, there is a good chance that the 2-year cycle which bottoms in July may begin to counter with some downward pressure which could last into that time frame.
In the meantime, a near-term correction may develop before we can move higher.
The following are examples of unsolicited subscriber comments:
Awesome calls on the market lately. Thank you. D M
Your daily updates have taken my trading to the next level. D
… your service has been invaluable! It's like having a good technical analyst helping me in my trading. SH
I appreciate your spot on work more than you know! M
But don't take their word for it! Find out for yourself with a FREE 4-week trial. Send an email to ajg@cybertrails.com .
By Andre Gratian
MarketTurningPoints.com
A market advisory service should be evaluated on the basis of its forecasting accuracy and cost. At $25.00 per month, this service is probably the best all-around value. Two areas of analysis that are unmatched anywhere else -- cycles (from 2.5-wk to 18-years and longer) and accurate, coordinated Point & Figure and Fibonacci projections -- are combined with other methodologies to bring you weekly reports and frequent daily updates.
“By the Law of Periodical Repetition, everything which has happened once must happen again, and again, and again -- and not capriciously, but at regular periods, and each thing in its own period, not another’s, and each obeying its own law … The same Nature which delights in periodical repetition in the sky is the Nature which orders the affairs of the earth. Let us not underrate the value of that hint.” -- Mark Twain
You may also want to visit the Market Turning Points website to familiarize yourself with my philosophy and strategy.www.marketurningpoints.com
Disclaimer - The above comments about the financial markets are based purely on what I consider to be sound technical analysis principles uncompromised by fundamental considerations. They represent my own opinion and are not meant to be construed as trading or investment advice, but are offered as an analytical point of view which might be of interest to those who follow stock market cycles and technical analysis.
Andre Gratian Archive |
© 2005-2022 http://www.MarketOracle.co.uk - The Market Oracle is a FREE Daily Financial Markets Analysis & Forecasting online publication.