


Inflation Bond Issuance Hits Record $200 Billion ahead of Deflation
Economics / Deflation Mar 22, 2010 - 07:32 AM GMTBy: Mike_Shedlock

 Concerns about global inflation are once again picking up. Please consider the Financial Times article Inflation-linked issuance to hit record $200bn
A record $200bn issuance of new inflation-linked bonds from the US, Europe and the UK is forecast this year as governments seek to finance ballooning budget deficits.
Investors have become increasingly worried about the dangers of rising prices in the longer term, boosting demand for inflation-linked bonds. This follows the actions of central banks, which have pumped vast amounts of money into the financial system in the past year.
Investor appetite has also been boosted because so-called linkers are seen as a safe and stable asset class, attractive to investors who remain worried about the economic outlook.
The market has performed well in the past year. US Treasury inflation protected securities (Tips), the best-performing index-linked bonds last year, gave a total return of more than 10 per cent, according to Bank of America Merrill Lynch indices.
Barclays forecast that the US Treasury will issue $80-85bn of Tips this year and as much as $125bn in 2011.
China To Determine Dollar’s Fate?
Still others are concerned that China holds key to dollar’s fate
In July of 1997, when the Bank of Thailand was forced to devalue the baht, few analysts anticipated that the move would lead to contagion affecting other countries in south-east Asia and that it would eventually spread to Korea and Taiwan.
Within six weeks of the baht’s devaluation, the Indonesian rupiah was in freefall, going from 2,300 to the dollar to well over 10,000. The computer systems of some Japanese banks crashed as they were not programmed to handle a move from four digits to five.
Fast forward a few years to the current economic situation, and the question is whether the US dollar will suffer a similar fate to the rupiah.
The week of March 8, the US dollar had its worst week since January, suggesting to economists at JPMorgan that the end of the dollar rally may well have arrived. Until now, one reason the dollar has held up well is that so many countries tie their currency to the dollar, most notably China. In April, the US Treasury will have to tell Congress whether China has been manipulating its currency against the backdrop of an increasingly strident debate between the two countries.
China may also slow its purchases of US Treasuries.
Most officials take the view that China would be cutting its own throat if it were to sell Treasuries, or even reduce its purchases significantly. But countries, like individual investors, are not always rational. ... If China decided after all that it would be damaging its own coffers less than the US, the dollar could be in for a period of much greater weakness.Implosion Prediction Madness
Articles like the above are easy to demolish. Yet, because they are so commonplace, they also offer evidence that economic pundits have no idea what is going on or how things even work.
For example, let's flashback to Aug 14 2009 when Jim Sinclair announced 85 days to go! for the dollar to crash in The Motivation Behind The Countdow.China as spokesman for the BRICs has publicly stated their desire for the institutions of a Super Sovereign Currency. This is not an intended as an immediate substitute for the dollar as a reserve currency but rather an alternative in new commitments.
It is my understanding that the BRIC countries, not China alone, have given the US until early November to deliver.
As a result of the above I see 81 days left for the US dollar.
I commented on the above prediction a couple weeks later in Countdown To Dollar Implosion Madness
Predictably Wrong
Maybe something happens in November, maybe not, but this dollar implosion countdown based on unnamed sources regarding impossible to believe demands and a trade chart interpreted ass backwards is more than just a bit silly. Yet, every day someone asks me about it, thus this reply.
The thing about these kind of predictions is how predictably wrong they have all been.
Based on interpretations of the Commitment of Traders Reports (COT) we have see a couple countdowns to running out of gold and or silver on COMEX by various people. Those never happened. We have seen "gold to the moon" hyperinflation calls based on backwardation. Those never happened, either.
There is also a bunch of hype going around right now about bank holidays and a devaluation of the dollar vs. all major currencies coming up this Autumn. The across the board dollar devaluation idea is potty because the US dollar floats. There is nothing to devalue it to. And even if there was, Europe and Japan do not want stronger currencies and would not go along. For that matter the US would not want to do it either fearing a market crash. Yet, the theories persist.
If something does happen in November, it will not be because some blogger knows something. It will be happenstance.
But for those counting, it's about 70 days. I can hardly wait.
A quick check of my calendar shows that November 2009 has come and gone. So has December 2009, January 2010, and February 2010. March 2010 will soon be gone as well.
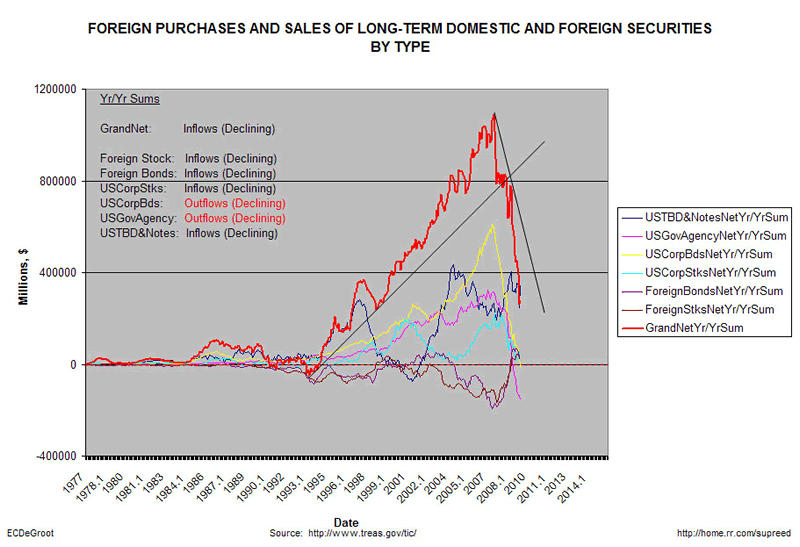
Sinclair posted the following chart with this comment:
"I find this simple chart so ominous I had to send it. Decelerating year-over-year inflows and outflows across the board. Stick your head in the sand if you like, but string this trend out a little longer and you’re going to have flight from the dollar."
Simple Math
The US runs a trade deficit with China. That means China will accumulate US assets. China does not have a choice in the matter; it is purely a mathematical function. When the US runs a deficit, mathematically someone must run a surplus.
China runs a surplus and buys US Treasuries. When the US deficit slows, China's buying of treasuries slows.
On March 11, in US 30-Year Treasury Bond Direct Bidders See Value, Step Up To The Plate And Buy I cautioned that falling demand from indirect bidders (foreign buyers such as China, Japan) was not a sign of weakness.
A Very Good Auction
In contrast to what many think about treasuries ready to blow up because of falling foreign demand, I repeat what I have been saying all along: US demand will pick up.
That aside, it is also important to point out that indirect bidding is related to trade deficits. When the trade deficit is high and rising, foreign buyers step up treasury buying as a purely mathematical function of parking inflows, although there is nothing that forces the buyers to go that far out on the yield curve.Renewed Deflation
On the March 11 Auction, indirect bidders fell to 23.9% yet yields were lower than expected. This shows US demand is more than adequate.
Hmmm. What is it the bond market sees that the equity market doesn't? Why have yields been consistently contained on the upside?
I will tell you in two words "renewed deflation".
Surprise Agreement With Paul Krugman
On two recent occasions I have been in agreement with Paul Krugman, once on the U.S dollar, and once on inflation.
Paul Krugman - March 20, 2010:America Is Not Indonesia
Urk. The FT publishes yet another dire warnings about the dollar piece — as news, not opinion! — comparing the US dollar to the Indonesian rupiah before the 1997-8 Asian crisis: ....
I shouldn’t have to explain this. There have been many, many papers trying to assess the possibility of an Asian or Argentine-style currency crisis for the United States; all of them run up against the simple fact that large foreign-currency indebtedness was central to these crises, and we just don’t have that problem.
Did the author of this article talk to anyone who has studied past currency crises? Obviously not.Of course the dollar could crash for other reasons. However, there is certainly no credible case at the moment no matter how hard people try to fabricate stories.
Paul Krugman - March 18, 2010: Stagflation Versus Hyperinflation
I’m a bit late to this, but Mike Kinsley has an odd piece in the Atlantic in which he confesses himself terrified about future inflation, even though there’s no hint of that problem in the real world. He’s not alone: there are a lot of voices predicting imminent hyperinflation in 2009, make that 2010 (and yes, I am keeping a record). ...
Kinsley seems to be confusing the logic of the natural rate argument, which says that expected inflation gets built into price-setting, so you need an accelerating inflation rate to keep unemployment below the NAIRU, with the very different logic of hyperinflation, which is about people fleeing money.
Meanwhile, for those predicting hyperinflation, my question would be: what is it about the United States now that looks different to you from Japan in say, 2000? Big budget deficits and high debt? Check. Huge expansion in the monetary base? Check. And yet Japan’s GDP deflator has fallen 9 percent since 2000.
I believe Krugman is correct on these issues, but horribly wrong on his views on China.
Moreover, I disagree with Krugman most of the time, especially his Keynesian cures that I believe will wreck the economy.
That said, I am a proud member of the shrinking group of people not on Krugman's hyperinflation list. Indeed, I was calling for the US to follow the footsteps of Japan long before it became somewhat fashionable to do so.
Inflation? Where Is It?
Want another opinion?
Please consider Inflation? Where?
Please click on the above link to see a stunning set of charts that Dave Rosenberg put together. The charts show that talk of strong inflation of any kind is complete silliness, let alone hyperinflation.
Here are my comments on Rosenberg's charts.
Bear in mind, I do not believe that prices constitute inflation or deflation. Rather I stick to my viewpoint that inflation is a net expansion of money supply and credit, with credit marked to market.
That last part "credit marked to market" is crucial. There is no doubt credit is collapsing. However, as a result of the Fed's heroic efforts that have kept zombie banks and zombie corporations alive, the mark to market valuation of credit (debt on the books of banks) has risen.
I cannot prove that because the Fed and the Financial Accounting Standards Board (FASB)have postponed mark-to-market accounting. However, I am willing to admit there has been inflation since March 2009 on the basis of how financial stock are reacting.
At some point however, the stock market will start reacting to actual fundamentals, and at some point investors will stop believing nonsense about the nascent recovery. At that point liquidity will turn, marked to market valuations of debt will again nose-dive, and stocks will take a nasty turn with it.
In the meantime, those who continually tell me that price is what matters need to look at 14 out of 18 charts and tell me they signal deflation or impending deflation, because by their measure they do.
Mr. Bond — Shaken, Not Stirred
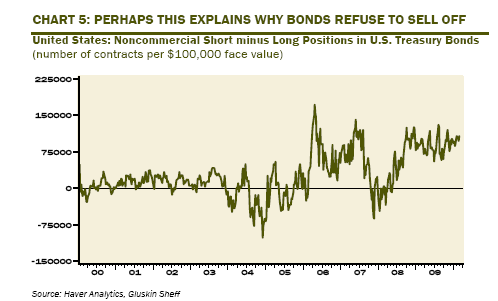
Please consider the following commentary from the March 18 Breakfast With Dave.
Chart 5 shows the net speculative short position in the long bond — from the latest Commitment of Traders report (each contract is $100,000 face value). The net short position as of last week was 107,382 contracts, the high end of the range.
So, perhaps this explains why bonds refuse to sell off — anyone who can sell them already has. What is truly striking is that even though Treasuries were among the best performing asset classes of the past decade, the noncommercial accounts spent 80% of that time being short the bond market. Yikes!
As an aside, the net speculative position (futures and options) on the S&P 500 is now long 205,000 contracts.
Seasonal Jobs Will Revert To Mean
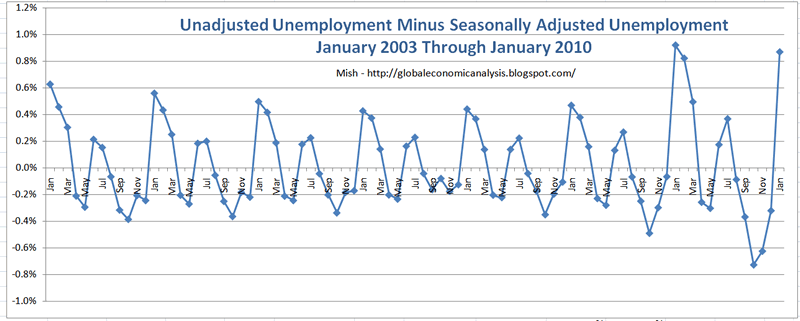
Here is one more chart to ponder.
I expect reversion to the mean in unemployment based on a chart I posted in BLS Seasonal Adjustments Gone Haywire; 11% Unemployment Coming by May?
Unadjusted Unemployment Minus Seasonally Adjusted Unemployment
Ducks In A Row
The ducks are all in a row now for an economic downturn. Expect economists to be surprised. Don't you be.
- Speculators are betting massively against treasuries
- Speculators are betting massively on equities.
- Mutual fund cash levels are at or near record lows.
- The Fed is starting to withdraw stimulus and wind down its lending facilities.
- Congress is reluctant to increase fiscal stimulus.
- On the jobs front, meaningless census hiring will likely get all the economists all excited about the nascent recovery. Yet the census jobs are temporary and will be gone by July.
- The above chart suggests a seasonal reversion to the mean in unemployment just in time for the mid-term elections. Those elections are guaranteed to bring about a much more conservative Congress.
By Mike "Mish" Shedlock
http://globaleconomicanalysis.blogspot.comClick Here To Scroll Thru My Recent Post List
Mike Shedlock / Mish is a registered investment advisor representative for SitkaPacific Capital Management . Sitka Pacific is an asset management firm whose goal is strong performance and low volatility, regardless of market direction.
Visit Sitka Pacific's Account Management Page to learn more about wealth management and capital preservation strategies of Sitka Pacific.I do weekly podcasts every Thursday on HoweStreet and a brief 7 minute segment on Saturday on CKNW AM 980 in Vancouver.
When not writing about stocks or the economy I spends a great deal of time on photography and in the garden. I have over 80 magazine and book cover credits. Some of my Wisconsin and gardening images can be seen at MichaelShedlock.com .© 2010 Mike Shedlock, All Rights Reserved.
© 2005-2022 http://www.MarketOracle.co.uk - The Market Oracle is a FREE Daily Financial Markets Analysis & Forecasting online publication.