


Gold Bouncing Off Long-term Moving Averages
Commodities / Gold and Silver 2010 Mar 28, 2010 - 10:00 AM GMTBy: Merv_Burak

 It was looking dicey there for a few days but the latest long term bull, which started in Oct of 2008, is still on going. Technically, gold is bouncing off its long term moving average line, otherwise, the sinking of a boat off North Korea helps get the jitters going.
SIMPLICITY
As readers to these commentaries understand, they are based upon simple technical techniques. Nothing fancy here. I’ve been asked on occasion as to why I do not involve myself in some of the more sophisticated, exotic or elegant techniques common to many modern day analysts. After all, aren’t the more sophisticated techniques more precise and offer better timing of the markets? Well, they may be more precise but as to whether they offer better timing, that’s a question mark. Most of these sophisticated techniques require far more time and effort and for a lazy person such as myself, that’s a non starter. Besides, in my 40 plus years in this business I have yet to come across any new techniques that provide significantly better timing than the tried and true simple techniques from the past. These have been used for many, many years and have proven themselves. P&F charting goes back to the late 1800s. Yes, they do give you the wrong answer on occasion BUT what technique, technical or fundamental, doesn’t. Besides when it does give you the wrong answer it quickly corrects itself so that you are not on the wrong side of the market for any length of time. I’ll stick with the simple P&F, trend, momentum (strength) and volume, with the occasional patterns thrown in for good measure.
GOLD : LONG TERM
The long term P&F chart remains bullish although the direction of the plot is now downward. Still not a concern.
As for the normal indicators, gold is bouncing off its long term positive sloping moving average line. I use the weighted moving average method for my moving average calculations rather than the simple method most commonly used by the industry. It is slightly more aggressive in its results as it applies greater weight to recent data and lesser weight to older data. The simple long term moving average line is still some distance below the gold price activity. As for the momentum indicator, it remains in the positive zone and is starting to once more head higher but still remains below its negative sloping trigger line. After bottoming out in April of 2009 the volume indicator took a sharp upward turn and was on a tear until about Nov. Since Nov the indicator has been in a basic lateral trend with some significant ups and downs but not getting anywhere. It is still slightly below a negative trigger line but that could change momentarily. The long term rating remains BULLISH.
INTERMEDIATE TERM
Although gold has had a day or two of upside action it remains below its negative sloping moving average line at the Friday close. The momentum indicator has been hugging its neutral line for some time now, going above and below as the daily price action changes. At the Friday close the momentum indicator has once more closed above its neutral line in its positive zone. However, it remains below its negative sloping trigger line. As for the volume indicator, it has been in a tight horizontal box for the past couple of months now and remains in the box. It is, however, slightly above its positive sloping trigger line for a slight positive message. The intermediate term rating has been up graded to a – NEUTRAL rating, one level above a full bear. This is a positive change from a previous bear.
SHORT TERM
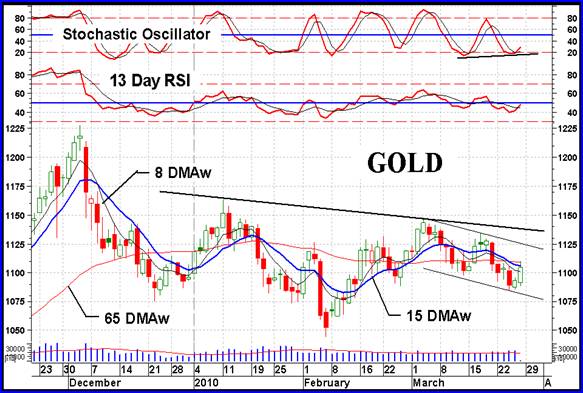
There are a few things going on from the short term. Although gold has had a couple of up days it has not yet breached its short term moving average line. It remains slightly below the line and the line remains in a downward slope. We have a short term downward sloping channel with gold bouncing off its lower support trend line but still within the channel. The daily volume action has been starting to improve but unfortunately this for both up and down days and therefore not giving any specific positive sign yet. The short term momentum indicator has crossed above its trigger line but the trigger remains sloping downward. The momentum indicator, although moving higher, is still in its negative zone. So, as of the Friday close the short term must still be rated as BEARISH but improving fast. The very short term moving average line remains below the short term line confirming the still bearish rating.
As for the immediate direction of least resistance, everything points to the up side. The aggressive Stochastic Oscillator had given us a positive divergence warning and has now moved above its oversold line and above its positive trigger line. It is now heading upward although still in the negative zone. Gold has moved above its very short term moving average line although the line has not yet turned upward. It may be a day or so early to call it an upward trend but that’s the way I’ll go.
SILVER
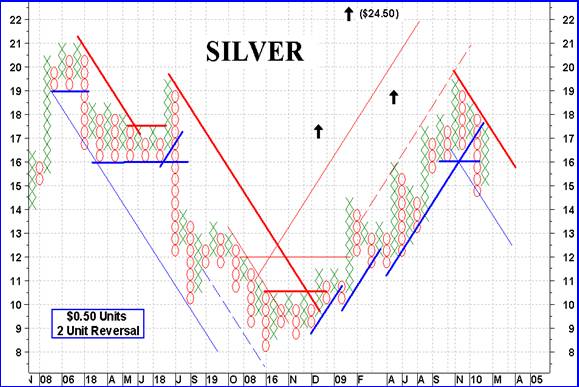
I’ve been using the P&F charts since the mid to late 1960’s and still don’t get tired of them. They are simple and filter out whatever amount of trading noise one does not want to be bothered by. Over the years I have developed my own P&F techniques and charting criteria that seem to have done a very reasonable job. Here we see a P&F chart of silver. We had a failed signal in mid-2008 at the $18.00 level which generated a loss of 11%. The bull signal in late 2008 resulted in a profit of 45% to its recent sell. We are now in a bear trend per this P&F chart. This chart represents an intermediate term move. By changing the unit values and/or the reversal criteria one can get a P&F chart to represent short or long term trends. Not all P&F charts are as good as this one so do not ALWAYS expect a chart to be beneficial. Practice and experience will determine which chart to use and which not.
Despite all the talk about silver having a better future than gold, one would not know it by its actions these past few weeks. Again, silver under performed gold during the week. I guess one should look longer term than the past few weeks.
Looking at the daily chart and indicators it looks like silver is in a transition trend, not bearish but not yet bullish in any of the time periods. From the daily charts I get ratings for the long and intermediate term as + NEUTRAL while the short term is still at – NEUTRAL.
PRECIOUS METAL STOCKS
The North American Gold and Silver Indices did not have a good week. Most were lower by about 3%. The Merv’s Indices, which show the average Index stock loss (or gain), were all over the place from 2.3% losses to 2.0% gains. The Indices that gained on the week were the three Indices with the most aggressive or speculative component stocks, the Gamb-Gold, Spec-Silver and Penny Arcade Indices. When the quality Indices move lower but the most speculative Indices move higher gives me confidence that the down moves in the quality stocks will not last long before they turn around to the up side.
I mentioned (above) the simple techniques for tracking the Indices and securities. One of the simplest is the Point and Figure (P&F) technique. It’s been around for over a hundred and twenty years and is still very compatible with today’s market. Of course one should review the criteria for its use and modify as required for the market or conditions of the day. Here is an example of how the P&F charting and trading could work. Please note that this is not a recommendation for the stock and most important, at the present price range I would be using a different criteria for continuing action. This chart shows the tracking of a stock decline, consolidation and finally upside break-out with projections as they develop.
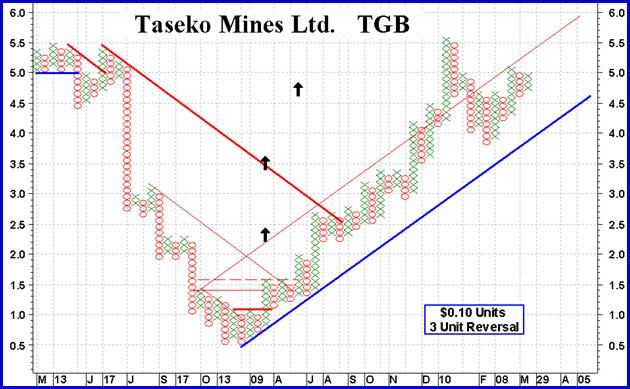
I’m not going into a tutorial on P&F here but just a few quick criteria. For a trend reversal I require a trend line break plus a move above two previous Xs or below two previous Os. For a buy transaction I also need a valid projection that shows at least a potential 100% move. And that’s about it.
On this chart the initial reversal was at the $1.20 level. The projection at that point was to the $2.40 level for a potential 100% move and a legitimate buy. We had a continuation signal at $1.50 with a $3.60 projection and another continuation signal at $1.70 with a projection at that point to the $4.80 level. The initial break was on a primary resistance and secondary trend line break. The subsequent continuation breaks were on secondary breaks. Finally, we get to the primary down trend line for a break involving both the primary trend line and a previous primary resistance break. This occurred at the $2.80 level with a projection at that point to the $7.80 level. At this point a change in chart units and/or unit reversal criteria may be justified for continuation of the move. There are more simple features to trading with P&F but you get the idea, it’s simple, takes very little time and effort and with a stop loss criteria is a mind easer during trading.
Merv’s Precious Metals Indices Table
Well, that will be it for this week.
By Merv Burak, CMT
Hudson Aero/Systems Inc.
Technical Information Group
for Merv's Precious Metals Central
For DAILY Uranium stock commentary and WEEKLY Uranium market update check out my new Technically Uranium with Merv blog at http://techuranium.blogspot.com .
During the day Merv practices his engineering profession as a Consulting Aerospace Engineer. Once the sun goes down and night descends upon the earth Merv dons his other hat as a Chartered Market Technician ( CMT ) and tries to decipher what's going on in the securities markets. As an underground surveyor in the gold mines of Canada 's Northwest Territories in his youth, Merv has a soft spot for the gold industry and has developed several Gold Indices reflecting different aspects of the industry. As a basically lazy individual Merv's driving focus is to KEEP IT SIMPLE .
To find out more about Merv's various Gold Indices and component stocks, please visit http://preciousmetalscentral.com . There you will find samples of the Indices and their component stocks plus other publications of interest to gold investors.
Before you invest, Always check your market timing with a Qualified Professional Market Technician
Merv Burak Archive |
© 2005-2022 http://www.MarketOracle.co.uk - The Market Oracle is a FREE Daily Financial Markets Analysis & Forecasting online publication.