


EXTEND & PRETEND: U.S. High Yield Debt Hitting the Maturity Wall!
Interest-Rates / US Debt Apr 05, 2010 - 03:10 AM GMTBy: Gordon_T_Long

 How long can the government continue to extend & pretend? How long can public policy endlessly ‘kick-the-can’ down the road without addressing the underlying causes? Such a critical point is often academically referred to as a ‘Tipping Point’ or what newsletter writer John Mauldin refers to as a ‘Finger of Instability’. I am more pragmatic and as an investor, who is forced to call the timing, I refer to it as the Maturity Wall.
In a recent article entitled "Sultans of Swap: Fearing the Gearing!" I outlined the growing amount of debt that will need to be refinanced and rolled over in the coming years. Since releasing that analysis the amount may now have reached a level where it may be too high to be scaled and we will hit the Maturity Wall. This level identifies the critical requisite timing that investors must be fully aware of.
According to Morgan Stanley, as outlined in a December article by Malcolm Maiden of the Brisbane Times, the US debt Maturity Wall looked like the following:
The Morgan Stanley, Fixed Income Research & Economics indicated at that time the US will require $4.2 TRILLION in new financing to accommodate loans of questionable viability, existing lending terms or loan to collateral value coming due.
 HIGH YIELD DEBT
On Monday March 15th Diane Vazza, head of global fixed-income research at Standard & Poor’s was quoted as saying "many companies whose debt matured in 2009 and 2010 have been able to extend their loans, but the extra breathing room is only adding to the bill for 2012 and after. That is because the record number of bonds and loans that were issued to finance those transactions typically come due in five to seven years". (2)
The New York Times in "Corporate Debt Coming Due May Squeeze Credit states that the "result is a potential financial doomsday, or what bond analysts call a Maturity Wall. From $21 billion due this year, junk bonds are set to mature at a rate of $155 billion in 2012, $212 billion in 2013 and $338 billion in 2014.
If we compare the current results to those reported by Morgan Stanley in Q4 2009, we are struck with the magnitude of the problem.
The chart to the right graphically represents the Maturity Wall associated with the High Yield debt line item alone.
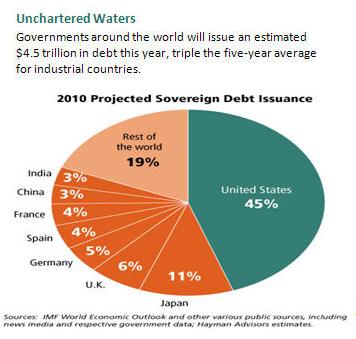
What about the recently announced US Government debt financing needs? Also Investment grade debt? Based on what has been reported only after a few months since Morgan Stanley issued their report, I minimally calculate the hurdle bar to be the following (without being able to add reliable Investment Grade debt figures for 2013 and 2014):
This table is also limited to the USA. The obvious question is whether there is sufficient global savings to accommodate this amount of US refinancing demand, plus the additional demands for the rest of the world.
There is little doubt it is going to be an Olympic record pole vault, being attempted in 2012, by then a very weary, debt challenged athlete!
US GOVERNMENT DEBT
What has surprisingly received little media attention is that the US Government has been steadily reducing the maturity of its treasury portfolio to keep fiscal deficits down. Whether interest rates rise or it becomes a problem for the US Treasury to re-fund the ever expanding roll-over pools, both suggest a Maturity Wall is dead ahead. It will occur no later than 2012, but it will likely be triggered with the next financial default scare.
EVERYONE HAS GONE SHORT DURATION
The chart below is very instructive in showing both the level of Interest Rate Swaps with durations less than one year and the rate at which this duration has grown over the last ten years for US banks.
We now have $75T in Interest Rate and Foreign Currency Swaps in paper with less than 1 year duration held by US Commercial banks. When interest rates begin to rise towards Morgan Stanley’s 2010 estimate of a 5.5% in the 10 Year US Treasury, watch out! You can expect dramatic market actions when $75T in derivative instruments start re-adjusting.
All our discussions so far have been about the US only. Let's take a look at the European and Global situation thanks to work done by Reggie Middleton at the BoomBustBlog.com.
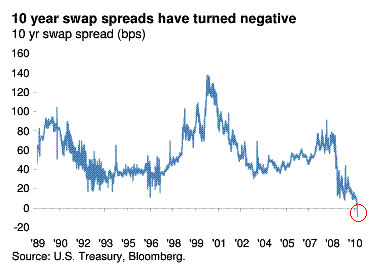
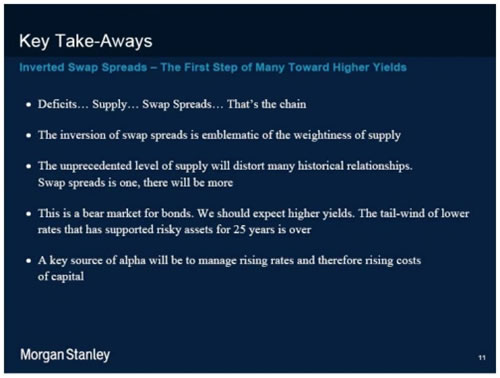
INTEREST RATE SWAP INVERSION GIVING US YET ANOTHER SIGNAL
“Historically, yields on government bonds have traded at a discount to the derivative as swaps are money market instruments whereas Treasuries reflect triple A sovereign risk. Funding a swap trade over time is more expensive than Treasuries, but constraints on balance sheets make it difficult for traders to implement such trades. Swap rates and Treasury yields have been converging in recent weeks, driven by high government bond supply, and increased demand by investors using swaps for meeting long-dated liabilities rather than committing capital to buying bonds.” (3)
Here is what is keeping Morgan Stanley up at night, and what is likely a catalyst for 10 Years to continue creeping to MS' 5.5% target on the bond.(4)
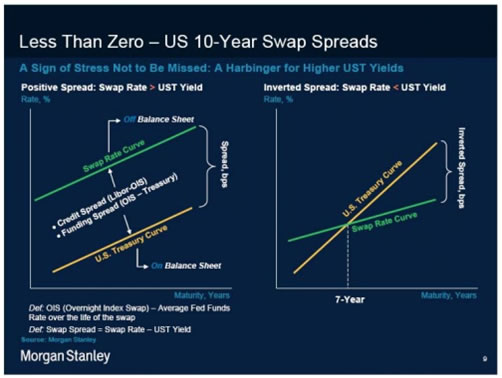
Is the swap spread merely a function of UNMATCHED ON - (UST) and OFF- (LIBOR) balance sheet supply?
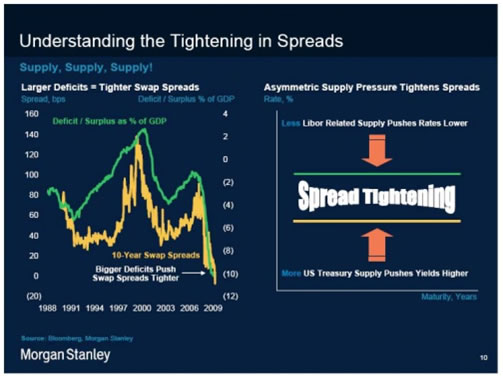
Deficits -> Supply -> Swap Spreads: Higher Yields
Morgan Stanley says it’s about SUPPLY, SUPPLY, SUPPLY. That is the SUPPLY of ON-Balance Sheet US Treasuries and the lack of SUPPLY from Off-Balance Sheet (Shadow Banking - SIV) LIBOR.
"The issuance of UST debt is dwarfing Libor-related issuance. For example, we expect UST net issuance to be $1.7Tr and net issuance of MBS to be zero. Thus, the relative issuance of UST's vs. Libor-based products mainly accounts for the inversion in swap spreads. This is a first sign of stress leading to higher UST yields and is not to be missed.” (5)
BUT IT IS MORE THAN JUST A SUPPLY / ROLLOVER PROBLEM (as if that is not bad enough)
“To put this in context you can look at the interest expense of The Federal Government. You will note that despite debt going up a lot in Fiscal 2009 the interest expense went down - a lot (about 15%.) But this year interest expense, if it tracks the five months thus far in the books, will rise from $383 billion to $434 billion, a 13% increase - almost erasing the "gains" from the zero interest-rate policy.
 On September 30th 2009 the outstanding debt was $11.909 trillion dollars. That is an average interest coupon across the entire float of the public debt of 3.22%.
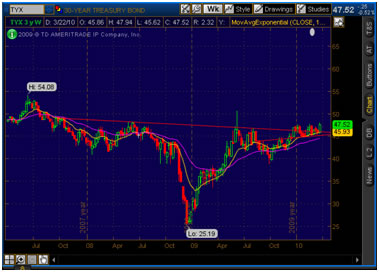
Now consider what happens if short rates go back to the 5% range - a historical reasonable point, and long rates go into the 7% range (a point that this chart's inverted head-and-shoulders, by the way, says is likely within the next two years):
Assuming Treasury continues to try to shove toward the short end of the curve, a strategy that exposes it to extreme amounts of rollover risk, the average coupon would likely rise to about 5.5%.
This would drive interest expense to $780 billion by September 2011.
Note that if historical averages hold, Treasury would take in roughly $1.2 trillion in personal income taxes. Interest expense would rise to consume approximately 2/3rds of that amount.
Let's further consider that interest expense would be about 80% of the entire budget deficit of fiscal 2011.” (6)
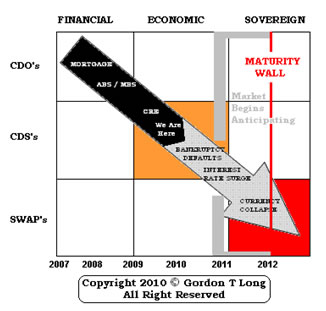
ROADMAP
With $492 Trillion outstanding in the notional value of global Interest Rate Swaps it is reasonable to conclude that, since one party on either side of these counterparty trades WILL GET HURT when rates rise, there is going to be a lot of hurting in a total global economy of only $45 Trillion.
All indications are that by 2012 the global economy is going to run headlong into a funding wall.
Markets always anticipate events at least 6 months in advance. This wall is so huge I doubt the market will wait. It will likely begin adjusting 12- 14 months ahead!
All bets are off if we get another sovereign or possible American State government surprise. This would move our Maturity Wall even ‘closer in’.
Caveat Emptor

Sign Up for the next release in the Extend & Pretend series: Extend & Pretend
SOURCES:
(1) 12-16-09 Wall of debt a barrier to US recovery – The Brisbane Times, Malcolm Maiden
(2) 03-15-10 Corporate Debt Coming Due May Squeeze Credit New York Times – Nelson Schwartz
(3) 03-23-10 Swap rate falls below 10-year Treasury yield Financial Times
(4) 03-29-10 Strategic Outlook: Greece, Negative Swap Spreads, Near-Term Caution In Europe, MBS Spreads And More Zero Hedge
(5) 03-27-10 More Than Meets The Bottom Line: Are Banks Getting Crushed Due To Negative Swap Spreads And The $154 Trillion IR-
Derivative Market? Zero Hedge
(6) 03- 27-10 Deficits And Debt-Financed Government The Market Ticker Karl Denninger
(7) 03-04-10 Corporate Debt Coming Due May Squeeze Credit Gordon T Long
(8) 03-31-10 Are There Signs From The Bond And Swap Spread Markets That Government Debt Risks Will Derail The Expansion?
Zero Hedge
(9) 03-27-10 What does the Greek Debt Crisis Mean for you? John Mauldin
(10) 03-26-10 This Guy is Really Pessimistic. He Must Be Using That Math Thing! Reggie Middleton’s BoomBustBlog
The last Extend & Pretend article: EXTEND & PRETEND - An Accounting Driven Market Recovery
FREE Additional Research Reports at Web Site: Tipping Points
Gordon T Long gtlong@comcast.net Web: Tipping Points
Mr. Long is a former executive with IBM & Motorola, a principle in a high tech start-up and founder of a private Venture Capital fund. He is presently involved in Private Equity Placements Internationally in addition to proprietary trading that involves the development & application of Chaos Theory and Mandelbrot Generator algorithms.
Gordon T Long is not a registered advisor and does not give investment advice. His comments are an expression of opinion only and should not be construed in any manner whatsoever as recommendations to buy or sell a stock, option, future, bond, commodity or any other financial instrument at any time. While he believes his statements to be true, they always depend on the reliability of his own credible sources. Of course, he recommends that you consult with a qualified investment advisor, one licensed by appropriate regulatory agencies in your legal jurisdiction, before making any investment decisions, and barring that, we encourage you confirm the facts on your own before making important investment commitments.
© Copyright 2010 Gordon T Long. The information herein was obtained from sources which Mr. Long believes reliable, but he does not guarantee its accuracy. None of the information, advertisements, website links, or any opinions expressed constitutes a solicitation of the purchase or sale of any securities or commodities. Please note that Mr. Long may already have invested or may from time to time invest in securities that are recommended or otherwise covered on this website. Mr. Long does not intend to disclose the extent of any current holdings or future transactions with respect to any particular security. You should consider this possibility before investing in any security based upon statements and information contained in any report, post, comment or recommendation you receive from him.
© 2005-2022 http://www.MarketOracle.co.uk - The Market Oracle is a FREE Daily Financial Markets Analysis & Forecasting online publication.