


Stock Market Technical Analysis : Trimming the Hedgies
Stock-Markets / US Stock Markets Aug 18, 2007 - 07:15 PM GMTBy: Dominick
 With so many bombs hitting the tape, and with massive short-covering rallies apparently never far behind, it was suggested last week that less experienced traders stay flat, or at least stay flat more often, as the market structure becomes more and more distorted by outside forces. Still, there were some fantastic setups this week we were able to take advantage of, and from here it looks like there's at least one more big move yet in store.
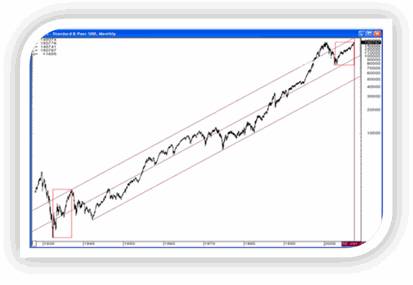
Of course, as you know, the Fed finally blinked this week and lowered its discount rate, and whether it was a surprise to you or not, the move fit perfectly into our market structure outlook and so we traded it accordingly. No one at TTC should have been caught short on the Fed, but my condolences go out to any trader who finally picked the right time to be thinking about shorting a market in a downtrend only to have their heads handed to them by a game-changing move by the “powers that be”. It's enough of a challenge to stay on top of the market's fundamentals and technicals week after week without having to worry about seemingly exogenous factors lighting a fire under your shorts. But in hindsight, it was certainly a good idea last week to suggest revisiting a January 3, 2001 chart.
Last week's update left off contemplating whether or not t o continue trading based on a bearish chart and said, “If the market doesn't gap down and sell off hard next week, there is a very bullish pattern waiting to setup and also a short term bullish pattern in a larger bearish count.” Instead of trying to force our bias on the market, we stood armed with the correct charts and waited for the market to let us know which direction to trade. Monday morning gapped up nicely, but the Fed's stingy liquidity injections kept the market uncertain as to what piece of bad news would hit next. The indices rolled over and we were left with no choice but trade to the downside, even though the 3 rd of a 3 rd down scenario never felt quite right.
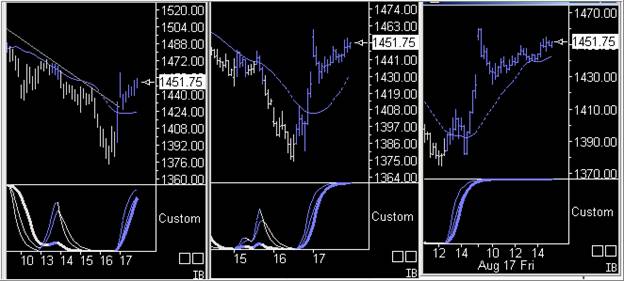
The chart below shows we've had 1432 as an important support/resistance level for some time, knowing that, if lost, we would re-enter or add to short positions from there. When 1432 gave out in a big way Wednesday afternoon, we traded guardedly knowing there was a B wave target minimum from the previous week at 1402, and that any sign of support there needed to be covered. It just so happened that's exactly where we opened on Thursday, which left only the unbiased with enough flexibility to play either direction the next day with the hugely capitalized.
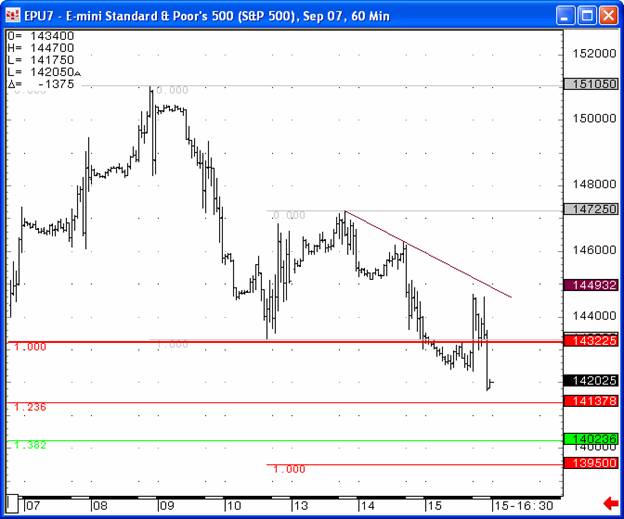
After two brutal down days, the move on Thursday morning was clearly going to be another move up to test the downtrend line, or something much bigger to the downside. And long time readers should get a kick out of the target we selected since it was the same as our famous upside target one year ago this week! Once support at 1402 gave way traders around the world jumped ship and simply got too bearish, taking the DOW down more than 300 points intraday, but all the while we kept our eye on the area I targeted back on August 14, 2006, an area which also proved its importance by providing the ultimate support for the selloff in March. The chart below shows our Thursday morning chart with a bullseye in the 1360/70 range, a fifty to sixty point ride from our go short level.
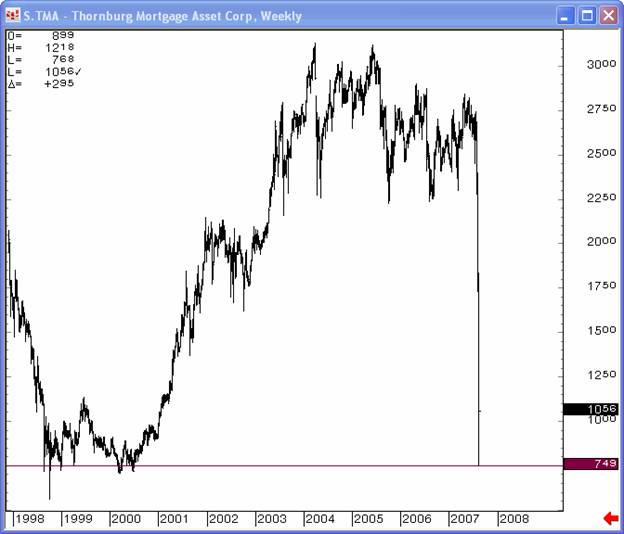
And so, while the Fed continued it's hard line, refusing to bailout the hedge funds, the quants, or the non-depository mortgage lenders, all of whom were tearing the market to shreds trying to unwind their hugely leveraged positions and meet redemptions, for a few hours there on Thursday, we got our market crash. You'd never see it in the closing numbers, but an intraday chart of one lender shows just how bad it got out there as traders sold everything that wasn't bolted down.
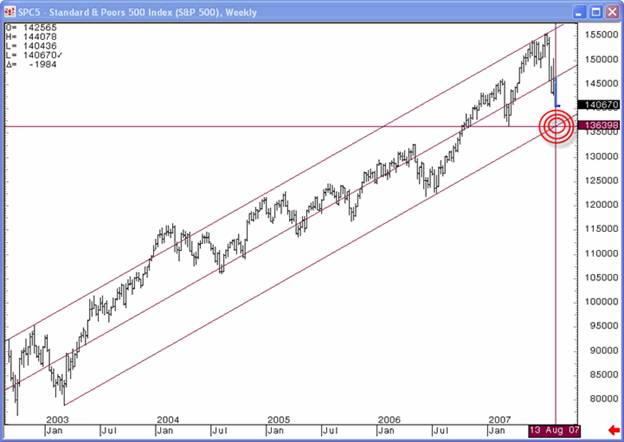
I've already addressed the PPT conspiracy theories, and I'm not saying they had anything to do with Thursday at all, but it sure looks like someone out there knows how to read a chart. In fact, it's moves like this that keep me thinking it's more important to trade the charts than try to game the news: Thursday's bottom was also a perfect, measured 1x1 from last week's high.
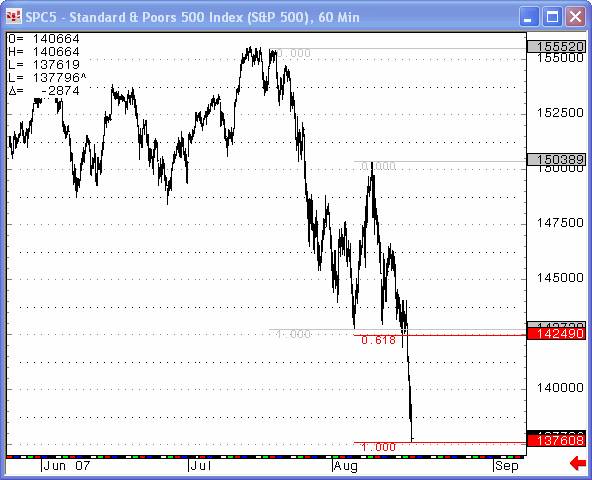
So, with the cluster of numbers in front of us and the S&P futures finding support at 1375, we had to buy that low and, go figure, the market took off like a rocket from there. I didn't expect my upside target to be reached so soon, but the market rallied that afternoon to close at good old 1432, again leaving the next direction completely up for grabs.
And, if that had been all, it still would have been a memorable week, what with a 600 point round trip day in the DOW and all. The major index futures traded lower overnight Thursday suggesting the morning's open would be lower, but then there was that fateful announcement from the Fed that sparked a huge rally that had the DOW opening up more than 300 points, and putting the open in the S&P just over the crucial 1450 opex strike, wiping out literally billions of dollars in puts in an instant. Though it looks like Bernanke will get the credit for punishing those who shorted the market against him, it's far more likely that his hand was forced by the massive withdrawals faced by Countrywide Bank on Thursday. The story was kept pretty quiet, but with the huge rally in short bonds and the complete breakdown of the corporate paper market, a potential run on the bank left the Fed with little choice but to intervene, crushing unsuspecting shorts in the process.
After the dramatic opening, Friday's trading was a little slower by this week's standards, and this is where, again, our proprietary trend cycle charts helped us sort out the movement. After a fairly typical gap test, the 5-min pegged and, when the 15-min hugged the top as the market started to move off the gap fill, it was a safe bet getting back over 1450.
Just like last week, caution and patience are going to be crucial for the days ahead. Now that the discount window is open, there's a good chance we're going to start finding out just how much damage is done. And though the Fed could still cut the target rate at anytime, there's probably going to have to be a few more bombs thrown at the tape before it does so. In other words, just sitting around in a position may not be the smartest thing to do.
What I know for sure is that the market is following these charts I keep posting and at TTC we're going to keep following them, too. The overall structure is not as easy to read as it should be because of all the distractions and manipulations, but two very powerful patterns, each moving in opposite directions, are viable from here. The market has spoken last week and the bears have one more chance at this. IF they cant succeed, I'll see you at the year end rally!
Either way, unlike all the big hedge funds that have taken a serious haircut in the past several weeks, we won't force our opinion on the market, we'll let it decide for us. After all, the beauty of being unbiased is that either direction will be just as well as the other because we know the important levels where the decisions will be made and are positioned to trade accordingly.
Members
Finally, be sure to check out our weekly “road maps” as that's where the real big picture shapes up, where we compile charts of any market that talks to us, ranging from a look at the last few weeks to huge timeframes all the way back to the 1900's.
Non-members
This update is a nice read, but it can't compare to these road maps. If you would like to take a peek at not only those charts, but stay the whole week with a full refund if we don't suit your needs, join and cancel within a week for a full refund! Join now and after staying a week within all the forums and live chat room it's simply not what you need, email me and ask for a full refund. You won't find an offer like that anywhere else. Offer ends August 25 th , 2007
Have a profitable and safe week trading, and remember:
“Unbiased Elliott Wave works!”
By Dominick
For real-time analysis, become a member for only $50
If you've enjoyed this article, signup for Market Updates , our monthly newsletter, and, for more immediate analysis and market reaction, view my work and the charts exchanged between our seasoned traders in TradingtheCharts forum . Continued success has inspired expansion of the “open access to non subscribers” forums, and our Market Advisory members and I have agreed to post our work in these forums periodically. Explore services from Wall Street's best, including Jim Curry, Tim Ords, Glen Neely, Richard Rhodes, Andre Gratian, Bob Carver, Eric Hadik, Chartsedge, Elliott today, Stock Barometer, Harry Boxer, Mike Paulenoff and others. Try them all, subscribe to the ones that suit your style, and accelerate your trading profits! These forums are on the top of the homepage at Trading the Charts. Market analysts are always welcome to contribute to the Forum or newsletter. Email me @ Dominick@tradingthecharts.com if you have any interest.
This update is provided as general information and is not an investment recommendation. TTC accepts no liability whatsoever for any losses resulting from action taken based on the contents of its charts, commentaries, or price data. Securities and commodities markets involve inherent risk and not all positions are suitable for each individual. Check with your licensed financial advisor or broker prior to taking any action.
Dominick Archive |
© 2005-2022 http://www.MarketOracle.co.uk - The Market Oracle is a FREE Daily Financial Markets Analysis & Forecasting online publication.