Gold and Silver Big Moves Ahead!
Commodities / Gold and Silver 2010 Apr 23, 2010 - 10:12 AM GMTBy: Peter_Degraaf
 When plunder becomes a way of life for a group of men in a society, over the course of time they create for themselves a legal system that authorizes it and a moral code that glorifies it."….. FREDERIC BASTIAT (From his important book ‘The Law).
COMMODITY ONLINE in a recent online poll of a sample size of 21,600 respondents selected from across the globe, found that 93% or 20,100 of the total sample size had indicated that there would be a fall in the gold price due to the recent upbeat mood in the global equity markets, while only 1,400 respondents contradicted the stand, and 105 did not comment on either side. This showed that most of the respondents believed that there would be a fall in gold prices in the near future due to a recovery in global equity markets.
This is good news! Contrarians love it when 93% of traders take a position that they can trade against!
Meanwhile Elliott Wave (EW) enthusiasts continue to stubbornly insist that the gold price is headed lower. The people who follow these advisors are losing out on the greatest gold bull market in history. After all if you don’t buy gold or silver while it is cheap, when will you buy?
EW practitioners are like people who drive down the highway with both eyes glued to the rear view mirror, oblivious to what lies ahead.
EW analysis works best when viewed in retrospect. The reason for this is very simple. Let’s assume that in ‘never-neverland’ corn was selling at 4.00 a bushel. The EW analysts, after drawing in their 1 – 5 patterns next predicted a drop in price to 3.00 a bushel. They expected this drop to move down in three stages marked A, B and C.
Meanwhile there was a drought in all of the corn-growing areas of never-neverland.
Price was beginning to rise. The EW analysts kept warning: “The price of corn is headed lower because Time is more important than price; when time is up price will reverse.” Ignoring the weather reports they looked only at the lines on the chart.
To apply EW analysis to the price of gold simply by drawing anticipatory lines on a drawing board is to ignore the billions upon billions of Dollars, Euros, Pounds, Yen, Rupees and Renminbis that are daily being printed and released into the world’s money pool.
Fundamentals combined with technicals are an ideal combination. For optimum results they are not to be separated. A number of bullish factors are listed at the bottom of this article.
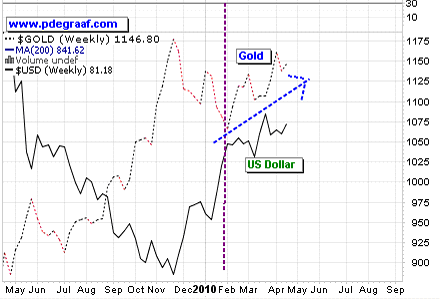
Featured is a chart that combines the gold price (dotted line), with the US dollar. Since the end of January, the US dollar has lost its influence over gold. This indicates fundamental strength in gold. As recently as December 2009, a rise in the US dollar caused gold to drop sharply. The fact that gold is ready to move on its bullish fundamentals renders negative comparative analysis (such as the rising US dollar) obsolete.

Featured is a chart that compares the silver price (dotted line) to the US dollar. As with gold, so has silver been rising in tandem with the dollar for the past several months. This is a very bullish signal for the precious metals.
Silver bullion sales are going through the roof. First quarter 2010 sales of US Eagles and Canadian Maple Leaf coins at the respective mints are at all-time high levels. During the first quarter the US mint used 9 million ounces of silver in the production of Eagles. At this rate the Mint will take 36 million ounces of silver off the table this year.
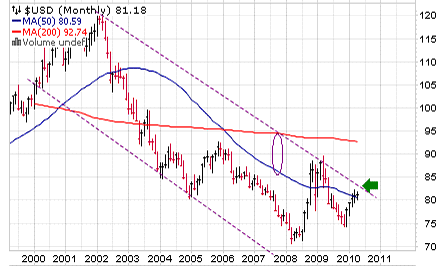
Featured is the monthly chart for the US dollar. The current rally in the dollar is a counter-trend move that is expected to run into resistance at the green arrow. The moving averages are in negative alignment and both are falling (purple oval).
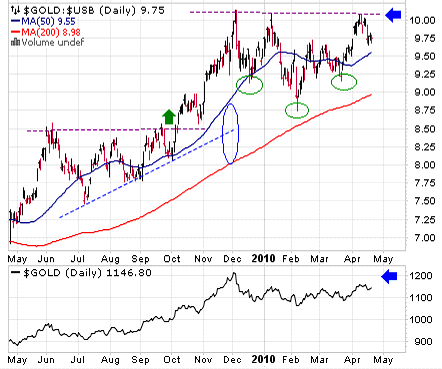
Featured is the index that compares ‘stuff to fluff’ (gold to bonds). If you’ll check my October articles in the archives, you’ll see that I pointed out to you the importance of the upside breakout at the green arrow to the price of gold (bottom of this chart is the gold price). At the same time I pointed out the bullish aspect of this trend as the 50DMA was and is, in positive alignment to the 200DMA (blue oval).
Today I stress the importance of the resolution of the current ‘inverted head and shoulders’ pattern (green ovals). The anticipated breakout at the blue arrow at the top will be matched by a breakout for gold at 1200 (bottom chart). The buildup to this coming breakout is underway right now!
The rising trend in this index points to a movement away from ‘fluff into stuff’. This trend will pick up steam once it rises above the 10.00 level.
Once the breakout is underway, the people who have allowed the EW analysts to cloud their thinking will climb aboard and keep the rally going.
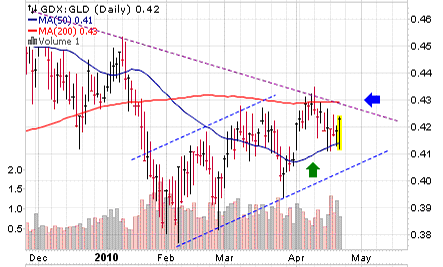
Featured is the index that compares gold stocks (GDX) to gold (GLD). For the past 2.5 months the stocks have outperformed bullion. This is a bullish development for both. The green arrow points to the fact that the 50DMA is beginning to rise again thus confirming the rising trend. Since the index bottom in February each new bottom has been higher – another bullish sign. The coming breakout at the blue arrow will start a mad rush into gold and gold stocks. At each of the turning points near the rising support line my subscribers were informed that the Gold Direction Indicator was turning bullish. It helps them to know when to buy and when to sell. At the moment the GDI reads a bullish 59%.
A powerful source of energy for gold and silver is the ‘real interest rate’.
At the moment US T-bills are yielding 1.5%. The rate of price inflation according to Mr. John Williams at Shadowstats.com is about 5.5%. This means inflation is eating away 4% of a dollar that is invested in a T-bill for a year. That is ‘negative real interest’, and gold historically thrives under those conditions.
The Producer Price Index for March shows producer prices jumped 0.7% with food rising at the largest rate in decades, 2.4%. It was the 6th consecutive rise in a row and this spells PRICE INFLATION.
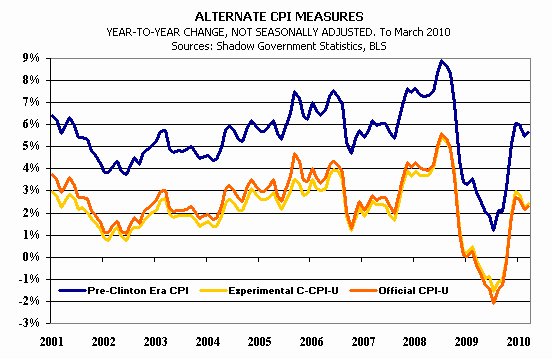
Chart courtesy Shadowstats.com. The blue line is the price index maintained by Mr. Williams who employs methods used by the government prior to 1992. These methods were subsequently changed to show a lower rate of increase.
Other bullish factors for gold and silver include the accelerated increase in national debt of which Greece is just the tip of the iceberg. Next in line will be Spain, Portugal, Ireland and Iceland. There will no doubt be others. In the USA a number of states are technically bankrupt and will be looking for the Federal Government to come to the rescue (read more money printing). These include California, New York, Illinois among others.
Finally there is the realization among investors that their paper gold certificates (including futures and options) have about 1 ounce of gold backing 100 ounce commitments. This game of ‘musical chairs’ will have a bad ending, except for those of us who demand ‘stuff’ instead of ‘fluff’.
Happy trading!
By Peter Degraaf
Peter Degraaf is an on-line stock trader with over 50 years of investing experience. He issues a weekend report on the markets for his many subscribers. For a sample issue send him an E-mail at itiswell@cogeco.net , or visit his website at www.pdegraaf.com where you will find many long-term charts, as well as an interesting collection of Worthwhile Quotes that make for fascinating reading.
© 2010 Copyright Peter Degraaf - All Rights Reserved
DISCLAIMER: Please do your own due diligence. I am NOT responsible for your trading decisions.
Peter Degraaf Archive |
© 2005-2022 http://www.MarketOracle.co.uk - The Market Oracle is a FREE Daily Financial Markets Analysis & Forecasting online publication.


