


More Stock Market Downside Pressure Coming - Leading Market Indicators: Part 2
Stock-Markets / Global Stock Markets Aug 29, 2007 - 12:47 AM GMTBy: Donald_W_Dony

 Last week, I reviewed three leading indicators of the S&P 500 and found only the Broker/Dealer sector was slowing turning positive. The other two leading indicators were both still declining. This week, three more key indicators will be examined for evidence of possible renewed strength and reversals.
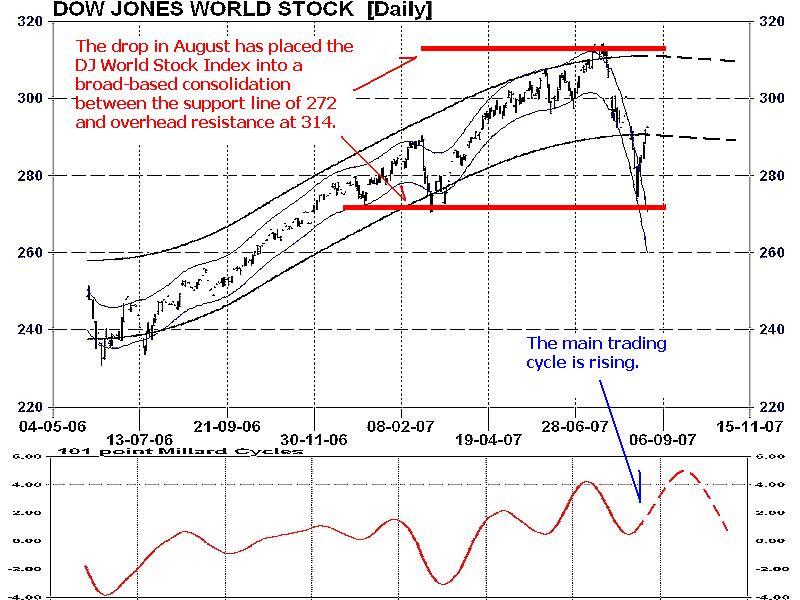
Due to the global economy, most major stock markets nowadays trend in the same direction and often turn up or down within the same week and many times on the same day. This 'unified trend' provides important information for reversals. The best gauge to use in analyzing the global markets is the Dow Jones World Stock Index (Chart 1). This security covers 3,000 companies from 120 countries and offers a true 'pulse' of the global equity markets.
This key index is showing some signs of returning strength after the rapid decline in August but is also now displaying a break from the five year uptrend that began in 2002. The DJWSI is no longer advancing but rather trading flat. This new action is a sign of a broader based weakness in global markets.
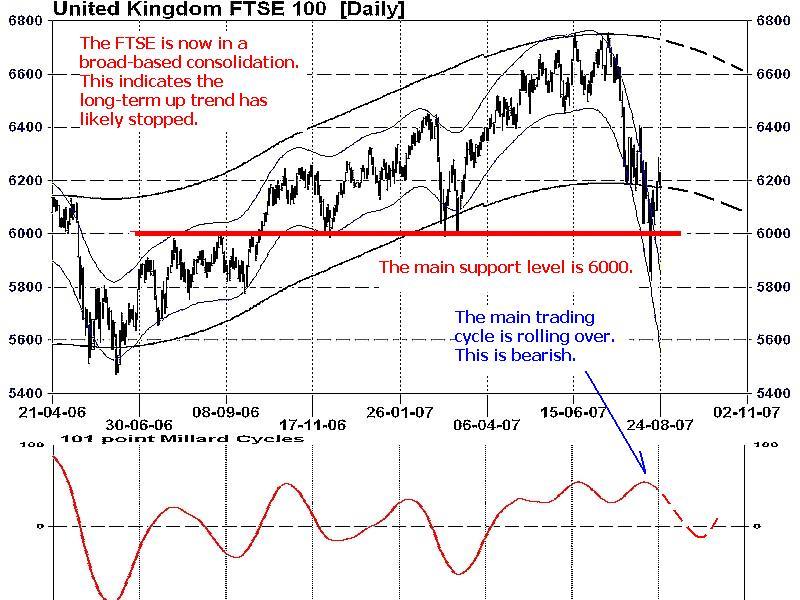
Due to the financial weighting of the FTSE, this index (Chart 2) has a strong tendency to lead the S&P 500 especially at market tops. Currently the index has bounced off of the 6,000 support level and is now falling back down to that same line again. This leading indicator remains negative.
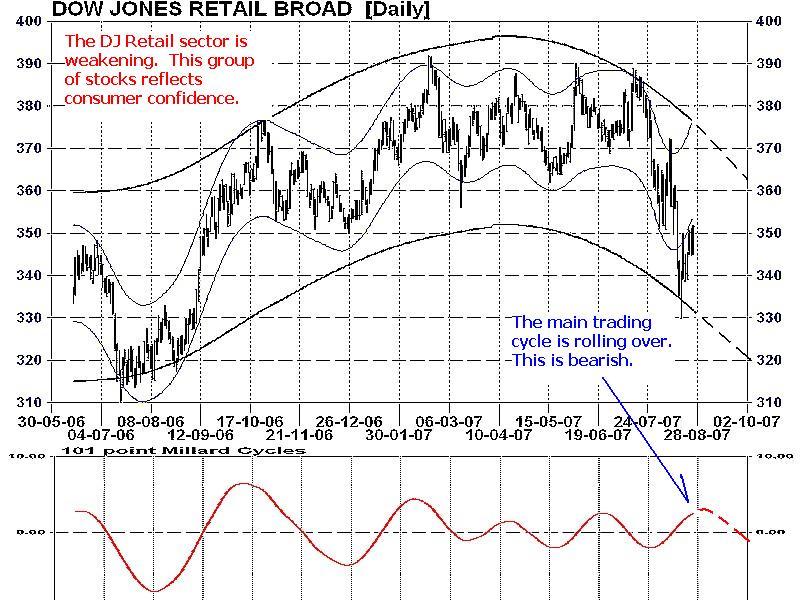
The last leading indicator is the Dow Jones Retail sector (Chart 3). Strength or weakness in this group of companies reflects the attitude of the consumer. And as the consumer is about 2/3rds of the economy, the trading direction of this sector speaks loudly about future direction of the economy and stock markets. Presently, this sector has pulled back to the summer 2006 level which shows on going pessimism about the economy from the consumer perspective. Weakness is anticipated to continue into the 4th quarter of 2007.
MY CONCLUSION: Over the past two reports, six leading indicators were examined and only the Broker/Dealer sector showed any signs of a low developing and a possible reversal. All of the other indicators remain weak and trending lower. Technical models point to a low for the major equity markets in the second half of September.
Bottom Line: Expect the lows of mid-August to be revisited and volatility to continue over the next 2-3 weeks.
More complete information about the current market consolidation and recommendations are in the up coming September Newsletter. This report will be posted on September 1st on the www.technicalspeculator.com homepage.
Your comments are always welcomed.
By Donald W. Dony, FCSI, MFTA
www.technicalspeculator.com
COPYRIGHT © 2007 Donald W. Dony
Donald W. Dony, FCSI, MFTA has been in the investment profession for over 20 years, first as a stock broker in the mid 1980's and then as the principal of D. W. Dony and Associates Inc., a financial consulting firm to present. He is the editor and publisher of the Technical Speculator, a monthly international investment newsletter, which specializes in major world equity markets, currencies, bonds and interest rates as well as the precious metals markets.
Donald is also an instructor for the Canadian Securities Institute (CSI). He is often called upon to design technical analysis training programs and to provide teaching to industry professionals on technical analysis at many of Canada's leading brokerage firms. He is a respected specialist in the area of intermarket and cycle analysis and a frequent speaker at investment conferences.
Mr. Dony is a member of the Canadian Society of Technical Analysts (CSTA) and the International Federation of Technical Analysts (IFTA).
Donald W. Dony Archive |
© 2005-2022 http://www.MarketOracle.co.uk - The Market Oracle is a FREE Daily Financial Markets Analysis & Forecasting online publication.