


Stocks Medium-term Bull Market May Have Started An Intermediate-term Correction
Stock-Markets / Stock Markets 2010 May 24, 2010 - 03:16 AM GMTBy: Andre_Gratian

 Current Position of the Market
Very Long-term trend - Down! The very-long-term cycles are down and if they make their lows when
expected, the bear market which started in October 2007 should continue until 2014.
SPX: Long-term trend - Up! We are in a medium-term bull market, which is a corrective move within a long term bear market. This bull market should last until 2011
SPX: Intermediate trend - It is likely that the index has made a top of intermediate nature. Unless it can hold above the 1044 level, the downtrend should continue until early July, and perhaps all the way into the Fall.
Analysis of the short-term trend is done on a daily basis with the help of hourly charts. It is an important adjunct to the analysis of daily and weekly charts which determines the course of longer market trends.
Daily market analysis of the short term trend is reserved for subscribers. If you would like to sign up for a FREE 4-week trial period of daily comments, please let me know at ajg@cybertrails.com .
Overview:
The SPX had a repeat of its Feb 6 decline, except that this time, it took a week to accomplish what was done earlier in just a few hours. This has to be deceleration☺! All kidding aside, considering the cycles that lie ahead, it’s going to be exceedingly difficult for the index to get back into an uptrend without some further correction. But it does not mean that it is going to continue its crash pattern without interruption.
To begin with, stocks are extremely oversold, and sentiment, as you will see, is at a level which is seldom attained. Also, the distribution bin is empty for now, and it will have to recharge before we can go lower.
The basic movement of the stock market is accumulation - uptrend, distribution - downtrend. Battles for supremacy are constantly fought between bulls and bears and they create trading patterns which are best observed on a Point & Figure chart. They can occur at the end of a bull or bear market, or within a trend, and whoever wins dictates the next prevailing trend
At the top of the 1220 rally, a Head & Shoulder formation was built which had the potential of sending the SPX down to about 986, or just a little lower. However, one of its phases had a count down to about 1060, and this is where the initial decline stopped before it rallied. Then, at the top of that rally, another distribution phase took place which also had a count down to about 1060, and this is where the second decline found support last Friday morning.
Exhausting the count determines the level at which the next battle will be fought, and allows the opposition to regain control for a period of time. On the hourly chart, it looks as if a little H&S pattern is being formed, but since a short-term cycle is due to make its low on Monday, it may alter the base pattern -- unless the cycle low was reached early, on Friday.
Whatever rally develops from the 1060 level, the SPX will have some serious hurdles to overcome if it tries to reach a new high. We’ll discuss these in the rest of the newsletter.
Analysis
Chart Pattern and Momentum
We’ll first analyze the intermediate trend by looking at the Weekly Chart. The rally from March ‘09 came to an end when prices found strong resistance at the dotted trend line. While lower dotted lines only caused a temporary halt in the rally and were subsequently overcome, this top looks more serious and has the profile of a potential intermediate reversal. The decline started after significant divergence showed in the lower (breadth) indicator. This oscillator would have to come out of its red down-channel and rise beyond the nearest top to signal a reversal. Positive readings would have to be generated in the above two as well.
Technically, the index remains in a short-term downtrend until it trades below the 1044.50 (red horizontal line). The odds of this taking place are good if you consider that some important cycles lie almost directly ahead. If it does trade below 1044.50, the decline could continue down to about 950.
Since the entire distribution phase at the 1220 level gives us a potential total count to that general area (and this is confirmed by a Fibonacci projection), it is likely that this target could be reached by late June or early July in conjunction with the cycle lows marked on the chart . A rally should ensue with another potential dip into the October time frame when the 4-yr cycle is expected to bottom.
The Daily Chart is next. Here also, the sell signal came after negative divergence was established on the indicators. As of Friday, the daily indicators were still not showing any divergence nor have they given a buy signal, although the two lower indicators have turned up and a signal will be generated if the rally which started Friday continues.
In order for anything other than a near-term reversal to occur, the downtrend line will have to be bested and the index will have to rise above 1174. Even if it manages to do this, it would be surprising if a new high can be made under the current cyclical configuration.
The Hourly Chart gave us some hints that a reversal would take place on Friday. Positive divergence began to show in the A/D oscillator on Thursday, and all three indicators were displaying it when the SPX made its low on Friday morning. By the close, they had given a buy signal and were in an uptrend.
The SPX appears to be making a H&S reversal pattern. The two shoulders on the left may be matched on the right by a little dip into the short-term cycle low which should come Monday around the fourth hour of trading -- unless the cycle bottomed early, on Friday. If the H&S pattern is valid, the minimum projection for the ensuing rally should be 1120. That would correspond with the filling of a gap a few points below (light blue line).
On Friday, the index already started trading out of its steepest (black) channel. If it can rise to 1120, it will have cleared its next (purple) channel, but will run into some stiff resistance at that level. Moving beyond it and overcoming the red trend line -- which is the top line of the broader channel identifying the trend from the 1220 top -- would be a bullish accomplishment which could be a precursor to making a new high. It would also be a surprising achievement at this stage of the decline.
Cycles
The SPX is under the influence of two dominant cycles: the 17-week cycle which is scheduled to make its low around 6/20, and the 2-yr cycle which could also bottom up to early July.
Beyond that, the 4-yr cycle should make its low in October. However, if it repeats its performance of 2006, it will be a non-event. Some cycles occasionally seem to go dormant for a period of time, and then re-assert themselves once again. We’ll have to see how this cycle will affect the market this year.
Over the very-short-term, the 16-wk cycle should ideally bottom on Monday (if it did not already do so early Friday).
Projections:
The pattern of distribution which formed between 1180 and 1220 can be broken down into distinct phases. There was a potential phase count down to about 1060 which was re-affirmed in the re-distribution pattern which formed between 1148 and 1173. Filling those counts has formed what is essentially a double-bottom at about 1060.
The index is now engaged in forming a base which already has a minimum count to about 1125, but is not complete if we have another pull-back on Monday. If the index eventually breaks below 1044, it will give a Fibonacci projection of 951 which finds a close equivalent in the full count across the 1220 top.
Breadth
The NYSE Summation index (courtesy of stockCharts.com) has lost its short-term positive divergence and is now making what could be a broad distribution pattern, or simply a corrective pattern. We’ll know which it is over the coming weeks. For now, judging by the RSI at the top of the chart, is it deeply oversold on the short term, which suggests that the market is ready to rally. The same hint is being given by my weekly and daily custom A/D oscillators which turned up on Friday. The hourly A/D gave a potential buy signal as early as Thursday.
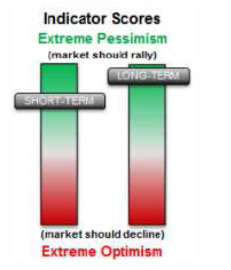
Market Leaders and Sentiment
By Thursday’s close, The SentimenTrader (courtesy of same) had risen to unprecedented levels of bullishness with both indices at the very top of their bullish range. After Friday’s trading, it remains extremely bullish, adding to all the other signs that we are ready to have a good rally.
The NDX is not showing much relative weakness to the SPX and does not portend the resumption of the bear market.
Gold
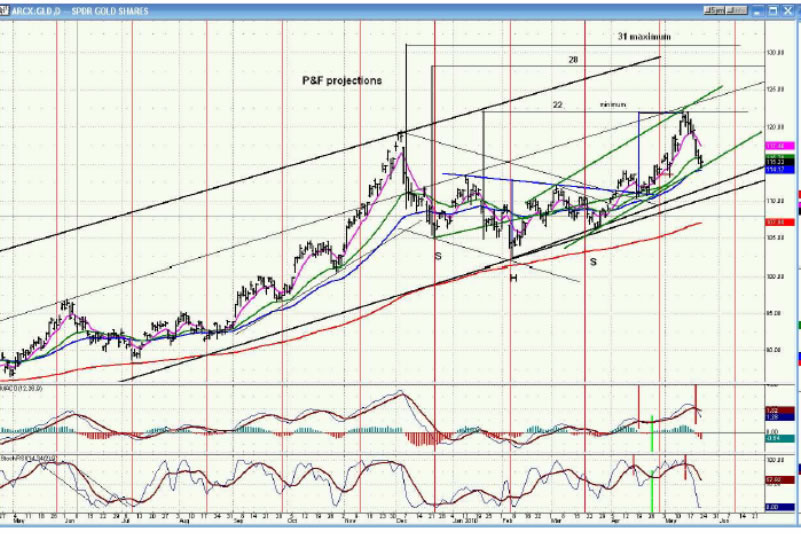
Gold is analyzed with the help of its GLD Daily ETF Chart. The last corrective pattern that was made after almost touching 120, was in the form of a H&S. The minimum projection for the H&S pattern was 122. This also matched a P&F projection to the same level. Note that when GLD reached that target, it also ran into the resistance provided by the mid-channel line which had temporarily stopped its rise on two previous occasions. These factors caused it to start a correction.
GLD has now reached the bottom of a bullish (green) channel and should also find support at its 50-DMA (blue). 122 was the minimum count for the H&S pattern, and also a conservative projection given by the P&F chart. There is a higher count taken across the entire H&S base to 128. Failure to reach it would be a sign that the ETF is preparing to make a deeper correction. Even if it does, the weekly pattern is becoming bearish.
Breaking below the bottom line of the black channel would be a confirmation that an intermediate correction has started.
Analysis of the Weekly Chart suggests that, because of its structural pattern, and because of the negative divergence developing in its indicators, the ETF may be reaching an intermediate top. During its last consolidation, that chart also formed a H&S base which gives a target of about 128/29. This matches the daily projection.
Longer term deceleration can be observed by the fact that the index is no longer able to reach the top of its green channel. Even if it went to 128, it would still fall short of the channel top. If the technical negatives continue to build, an important correction could be in the offing for gold.
Summary
The medium-term bull market which began in March 2009 may have started an intermediate-term correction. If so, the SPX should break below its early February low of 1044.50 and decline to between 975 and 950. While this is suggested by the cyclic configuration of the next few months, an extremely bullish sentiment indicator and deeply oversold breadth warn us that it is less than certain, and that it will not take place before a strong short-term rally.
Andre
If precision in market timing is something which is important to you, you should consider a trial subscription to my service. It is free, and you will have four weeks to evaluate the claims made by the following subscribers:
Awesome calls on the market lately. Thank you. D M
Your daily updates have taken my trading to the next level. D
… your service has been invaluable! It's like having a good technical analyst helping me in my trading. SH
I appreciate your spot on work more than you know! M
But don't take their word for it! Find out for yourself with a FREE 4-week trial. Send an email to ajg@cybertrails.com .
By Andre Gratian MarketTurningPoints.com
A market advisory service should be evaluated on the basis of its forecasting accuracy and cost. At $25.00 per month, this service is probably the best all-around value. Two areas of analysis that are unmatched anywhere else -- cycles (from 2.5-wk to 18-years and longer) and accurate, coordinated Point & Figure and Fibonacci projections -- are combined with other methodologies to bring you weekly reports and frequent daily updates.
“By the Law of Periodical Repetition, everything which has happened once must happen again, and again, and again -- and not capriciously, but at regular periods, and each thing in its own period, not another’s, and each obeying its own law … The same Nature which delights in periodical repetition in the sky is the Nature which orders the affairs of the earth. Let us not underrate the value of that hint.” -- Mark Twain
You may also want to visit the Market Turning Points website to familiarize yourself with my philosophy and strategy.www.marketurningpoints.com
Disclaimer - The above comments about the financial markets are based purely on what I consider to be sound technical analysis principles uncompromised by fundamental considerations. They represent my own opinion and are not meant to be construed as trading or investment advice, but are offered as an analytical point of view which might be of interest to those who follow stock market cycles and technical analysis.
Andre Gratian Archive |
© 2005-2022 http://www.MarketOracle.co.uk - The Market Oracle is a FREE Daily Financial Markets Analysis & Forecasting online publication.