


Gold, Dow And The South African Rand
Stock-Markets / Financial Markets 2010 May 24, 2010 - 12:37 PM GMTBy: Hubert_Moolman

 Last week was a very interesting week in the gold market. Those people who think that gold is going down from here have a big surprise coming. However, we will probably have more of these scary drops in the gold price as we continue into this volatile phase of the gold bull market. The good news for gold bugs is that we will also have some huge up days, and the general trend will be very much up. Is a $50 or $100 up day coming soon?
Since I last wrote about the Dow/gold ratio, it has gone from 9.42 to about 8.65 (gold closed on $1165 on that day). This trend should continue and even accelerate over the coming months. Gold is looking very good, whereas the Dow is susceptible to testing the 9000 level.
Gold
The obvious thing that stands out, when looking at the gold chart, is that textbook reverse head and shoulder formation, as shown below:
chart generated on fxstreet.com
As you can see, the price broke out of the neckline at about $1170 and has returned to test the breakout on Friday. Should the $ 1166 level hold, then we will see some significant gains going forward. My forecast for the gold price, using fractal analysis, is still very much on track. More details of where I think gold is going, and how it is going to get there, are provided in my free newsletter (see below).
DOW
As mentioned previously, the 10 Dow/gold ratio has in the past proven to be a key level, from where either the Dow or the gold price has taken off to new highs at a relatively fast rate. When either the Dow or the gold price has rallied (as explained in the previous article) from the 10 Dow/gold ratio level, the other always went sideways and then eventually down (never higher). See Dow chart (from Yahoo finance) below, where I have highlighted the points where the Dow/gold ratio had turned around at or just below 10.
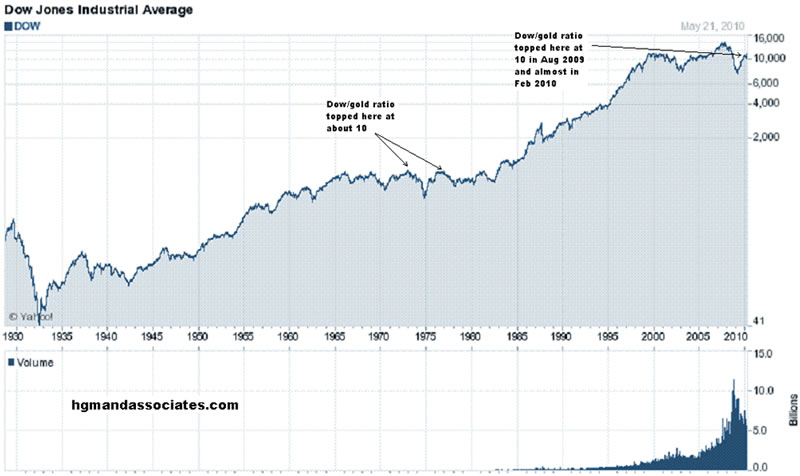
You will notice that in 1973 and in 1976, after the Dow/gold ratio had just turned below the 10 level, the Dow then turned down (going slightly sideways at first).
In August 2009 (and almost in February 2010), the Dow/gold ratio again tested the 10 level after going as low as 7 earlier in 2009. It has since retreated to the 8.65 level and will soon go much lower (in my opinion). Therefore, in my opinion, we are once again at a similar point in time. Gold is already rallying, and the Dow is about to go sideways and then down. So if one goes by the past, then very soon no upside price action (or at least not much) should be expected for the Dow. In fact, I expect the Dow to test the 2009 low within the next 2 years or so.
Is the South African rand supporting my opinion?
The South African rand has been a fairly reliable measure or proxy for risk aversion. When the general markets take a hit and everyone is running for safety, the Rand usually gets hit hard.
Below is a chart of the US dollar/SA rand exchange rate:
chart generated on fxstreet.com
On the chart, I have indicated the points where the Dow actually topped or bottomed. I have also indicated a point where the recent top of the Dow is (19 April 2010). You will also notice that I have indicated a possible trading range between 7.2 and 7.87. The battle to conquer that 7.87 level is currently underway. Should the Dollar/Rand close comfortably above that 7.87 level, we could go to the 8.5 level very quickly. This could likely mean a quick drop in the Dow to possibly the 9000 level. Below is a chart of the Canadian dollar/South African Rand exchange rate
chart generated on fxstreet.com
I have indicated two fractals, which I have numbered 1 to 6, to illustrate a possible match of the two patterns. As indicated, a break-out at the 7.50 – 7.55 level, and the rate can move to 8.5 in a flash. Again, this could likely signal trouble for the Dow.
You can find me here for current gold and silver commentary:
http://blogs.24.com/hubertmooolman
You can find me here for educational gold and silver commentary:
http://hgmandassociates.com/
***
If you find this information useful, please forward it to friends or family so that I can continue to reach people that would not normally read such informative sites as this one. If you would like to subscribe to my newsletter, please send me an email. My newsletter is free and I send it out whenever I feel I have relevant information to share. I do gratefully accept donations though, so that I can continue to research and write. Send me an email for details .
May God bless you.
Hubert Moolman
You can email any comments to hubert@hgmandassociates.co.za
© 2010 Copyright Hubert Moolman - All Rights Reserved
Disclaimer: The above is a matter of opinion provided for general information purposes only and is not intended as investment advice. Information and analysis above are derived from sources and utilising methods believed to be reliable, but we cannot accept responsibility for any losses you may incur as a result of this analysis. Individuals should consult with their personal financial advisors.
© 2005-2022 http://www.MarketOracle.co.uk - The Market Oracle is a FREE Daily Financial Markets Analysis & Forecasting online publication.