


U.S. Stock and Bond Market Total Return vs Price Return
Stock-Markets / Stock Markets 2010 May 28, 2010 - 03:06 AM GMTBy: Richard_Shaw

 We read several blogs lately that lamented the lack of total return charts, instead of merely price charts. While total return is less readily available in charting services than price only, there are some indexes that are available in both price return and total return (price + dividends or interest).
This article presents several of those dual charts based on MSCI data and Dow Jones data. The MSCI data came directly from MSCI, and the Dow Jones data and charts came from StockCharts.com
The MSCI data is for US large-cap, medium-cap and small-cap stocks. The Dow Jones stock data is for the Dow Jones Composite index (industrials, transports and utilities combined). The Dow Jones bonds data is for actively traded high quality US corporate bonds.
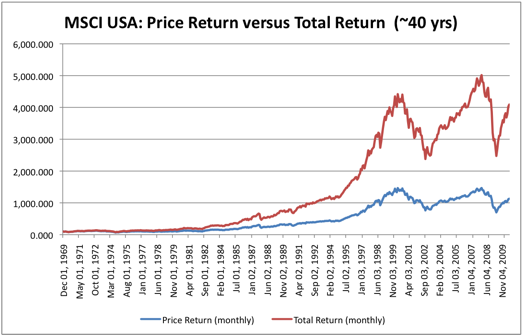
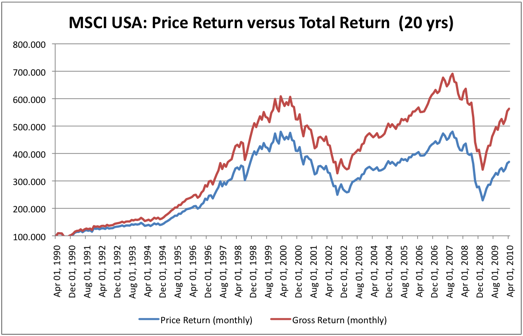
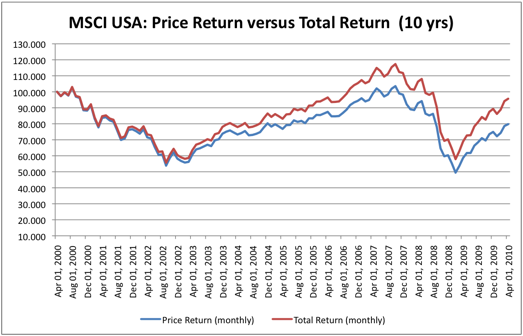
The MSCI data in each chart is indexed to 100 from the start date -- in effect how did $100 grow (before tax effects) on a price basis and on total price + dividends basis. The Dow Jones data is expressed as cumulative percent return.
MSCI USA Index
Over 40 years, total return produced about 3.9 times as much value as price alone. End values are 4,090 and 1,130.
Over 20 years, total return produced about 1.7 times as much value as price alone. End values are 563 and 370.
Over 10 years, both lost money, but total return produced less of a loss. End values are 96 and 80.
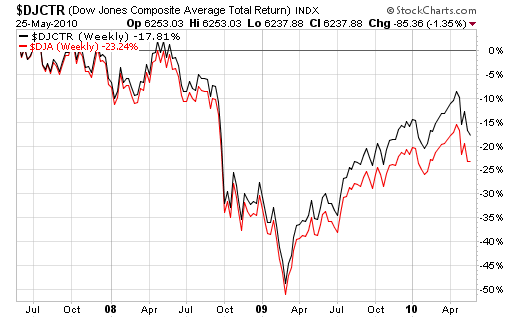
Dow Jones Composite Index
Over 3 years, the Dow Jones Composite total return was negative, as was the price return, but less so. End values of the cumulative return are -17.81% versus -23.24%.
Over 1 year, the Dow Jones Composite total return was positive, as was the price return. End values of the cumulative return are 23.71% and 20.24%.
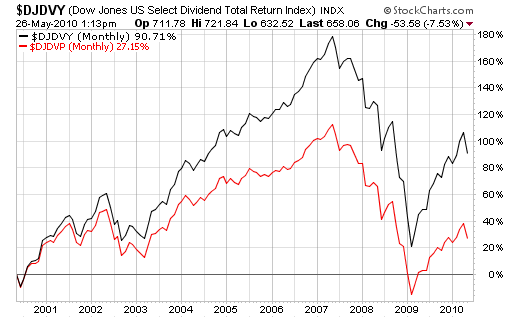
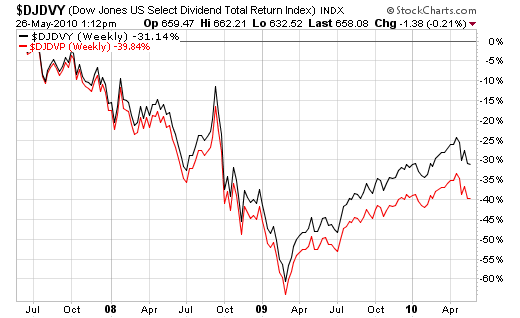
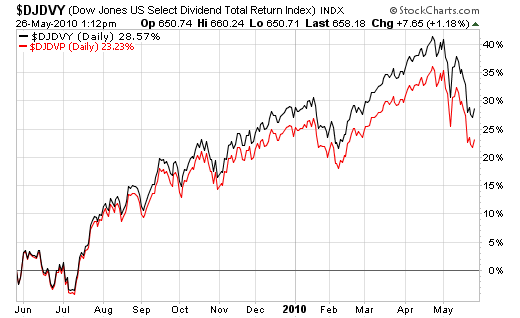
Dow Jones Select Dividend Index
Looking at the Dow Jones Select Dividend index over 10 years, we see a 90.71% cumulative total return versus a 27.15% cumulative price return. As expected the spread between the total ad price return for the dividend index is wider than for the broader stock index.
Looking at the Dow Jones Select Dividend index over 3 years, we see a -39.84% cumulative total return versus a -31.14% cumulative price return. The Select Dividend returns are lower than for the MSCI broad index.
Looking at the Dow Jones Select Dividend index over 1 year, we see a 28.57% cumulative total return versus a 23.23% cumulative price return. The Select Dividend returns are higher than for the MSCI broad index, and the Select Dividend spread between total return to price return was 5+% versus 3.5% spread for the MSCI index.
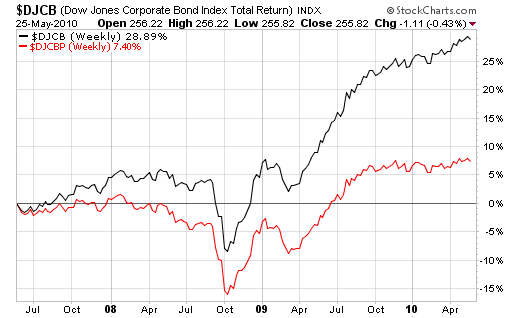
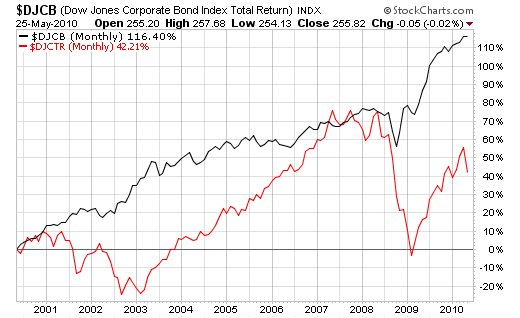
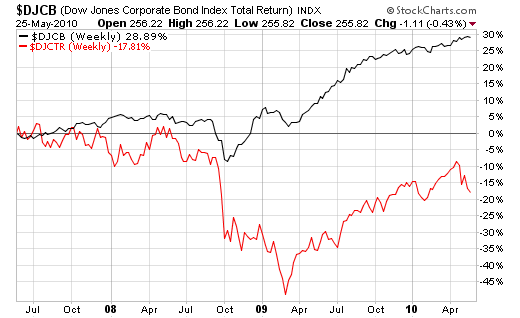
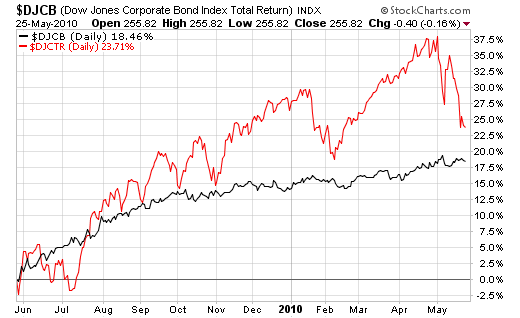
Dow Jones Corporate Bond Index:
Over 3 years and 1 year, corporate bonds produced much more total return than price return. That makes looking at bond fund price charts much less useful than looking at stock price charts. You really need to make sure you are looking at bond total return charts not price charts over periods that capture investment income. Bond total return over 3 years was nearly 29% versus price return of 7+% (bonds in black and stocks in red). Bond total return over 1 year was 18+% versus price return of nearly 12%.
Dow Jones Corporate Bonds versus Dow Jones Composite index:
Over 10 and 3 years, corporate bonds substantially outperformed stocks. Over 1 year stocks have outperformed bonds by about 5%, but bonds still turned in a nearly 18% return (with far less volatility).
A security closely related to the MSCI USA indexes is VTI. The Dow Jones Select Dividend index is tracked by DVY. The Dow Jones Corporate Bond index is similar to the index for LQD.
Holdings Disclosure: As of May 26, 2010 we hold LQD is some but not all managed accounts. We do not have current positions at this time in any other securities discussed in this document in any managed account.
By Richard Shaw http://www.qvmgroup.com
Richard Shaw leads the QVM team as President of QVM Group. Richard has extensive investment industry experience including serving on the board of directors of two large investment management companies, including Aberdeen Asset Management (listed London Stock Exchange) and as a charter investor and director of Lending Tree ( download short professional profile ). He provides portfolio design and management services to individual and corporate clients. He also edits the QVM investment blog. His writings are generally republished by SeekingAlpha and Reuters and are linked to sites such as Kiplinger and Yahoo Finance and other sites. He is a 1970 graduate of Dartmouth College.
Copyright 2006-2010 by QVM Group LLC All rights reserved.
Disclaimer: The above is a matter of opinion and is not intended as investment advice. Information and analysis above are derived from sources and utilizing methods believed reliable, but we cannot accept responsibility for any trading losses you may incur as a result of this analysis. Do your own due diligence.
Richard Shaw Archive |
© 2005-2022 http://www.MarketOracle.co.uk - The Market Oracle is a FREE Daily Financial Markets Analysis & Forecasting online publication.