


Second Stocks Bear Market, The Right Path!
Stock-Markets / Stocks Bear Market Jun 07, 2010 - 02:39 AM GMTBy: Steve_Betts

 "Our government has kept us in a perpetual state of fear - kept us in a continuous stampede of patriotic fervor - with the cry of grave national emergency. Always, there has been some terrible evil at home, or some monstrous foreign power that was going to gobble us up if we did not blindly rally behind it." ---General Douglas MacArthur (1880-1964)
One of the Federal Reserve Bank presidents came out and announced that the “natural level” of unemployment should be 7%, and not the 4% target that has stood for decades. Soon enough they’ll be revising that figure up to 10%! Then of course we had the unemployment report on Friday that created a stir. At first glance it seemed great with 430,000 new jobs created and the unemployment rate falling to 9.7%, but with any government statistic it always pays to look below the surface. If you dig a little you’ll see that 411,000 jobs were the result of the government hiring census workers, a temporary position, and the reason for the decline to 9.7% was due to the fact that 322,000 people fell out of the ranks of the unemployed because they had given up looking for work. Dig deeper yet and you’ll see that improvements in the March and April statistics had been revised downward adding to the already grim scenario. I have maintained for some time that the “improvement” previously reported in the government’s numbers was due basically to the manipulation of the birth/death ratio, and not to a strengthening economy. Just go out and ask anyone who truly works for a living in the US and they’ll tell you that things are not getting any better.
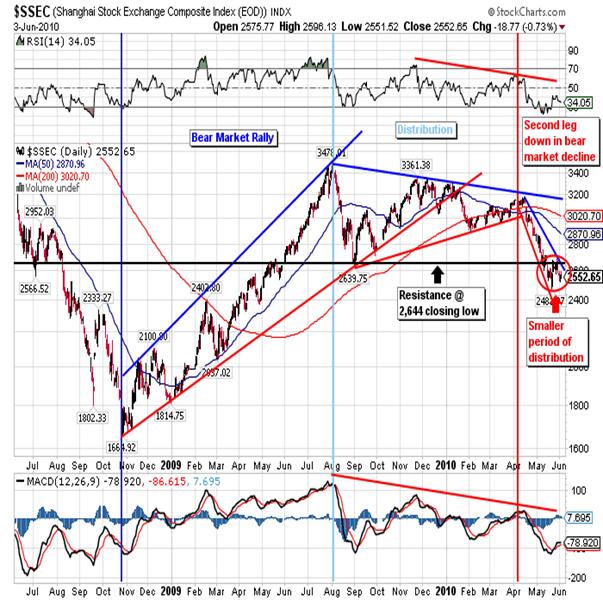
The situation overseas don’t look any better as worries over Greece have been expanded to include Spain, Portugal, Italy, and Ireland, and on Friday they threw Hungary and Bulgaria into the mix as well. Actually all of eastern Europe is in the same boat as they spent billions in borrowed money building new production facilities, and now they face declining world demand for just about everything. China now finds itself in the same soup but it still has reserves to burn, if its numbers are to be believed. It is obvious from looking at the chart of the Shanghai Exchange that the party is over and it will eventually test the October 2008 lows. Right now the Shanghai Index appears to be going through a small period of distribution, but I am convinced it will head lower sooner rather than later.
The overall scenario is dark to say the least, it will get a hell of a lot darker as the year drags on, and that brings me to the topic of this report. In the daily report for Friday I began to lay out what I believe is the only way to make money in this market, in part because I see all of my clients doing just the opposite. Everybody is trying to “trade” the markets, i.e., sell the peaks and buy the dips, and they are being cheered on by a large majority of analysts who are actually bullish stocks. So in Friday’s report I laid out my reasoning for why this is a bear market in stocks and I took an initial short position in the Dow as a real life example. Unfortunately, I got ahead of myself so I want to back up and lay some real ground work with respect to the proper attitude required to invest in a market. I have several rules which serve me well and I want to share them with you:
- “Everybody” is always wrong – whenever you see everyone heading in one direction, or buying one thing, you would be well served to do nothing, or better yet do the opposite.
- Listen to the TV with the mute on – the only thing the news gives you is history and Friday was a perfect example. According to the financial news network the reason for the 323 point decline in the Dow was directly related to the poor employment report. This is ignorance at its best. The market is a forward looking instrument discounting things it sees six to nine months into the future. Friday’s employment report was history and therefore discounted months ago. It is worthless information for an intelligent investor.
The average investor is reacting to the “news” he hears and chasing the market based on that news. He treats the news as if it’s a diamond in the rough when in fact it’s the sewage of the financial system. The smart money is taking a position based on what it thinks will happen months down the road, while the man on the street invests based on what happened months ago. That’s why the average man loses money.
- When the primary trend is up you either sit on the sidelines or you buy. When the primary trend is down you either sit on the sidelines or you sell short. You never go against the primary trend.
- Along that same line of thought if an initial trade loses money, you never make a second trade trying to average down your losses. By losing money on the first trade the market has told you that you are wrong, so do not compound an error.
- Keep your own council! Perhaps this should have been at the top of the list. It’s your money; take responsibility for it. If someone loses your money it should be you, and if someone makes money with your money it should be you.
- Study the markets! Most people spend a lot more time picking out the sofa for their living room then they do deciding what should go into their pension funds. That is so wrong on just about any level.
- If you get out of bed with the intention of trading, you’ll end up broke. During the course of a year you’ll be lucky to find thirty good trades. On half of those trades you’ll probably be too early so you have to make two or three attempts with an initial position before you get it right.
- Let your profits run and cut your losses as fast as you can. Most live with their losses hoping that the market will finally turn around in their favor. Hoping is for suckers!
There’s more but that’s a lot to digest in one sitting, and it’s enough to get you started. This are rules that I will follow to the letter as I build a portfolio in front of your eyes throughout the course of this year.
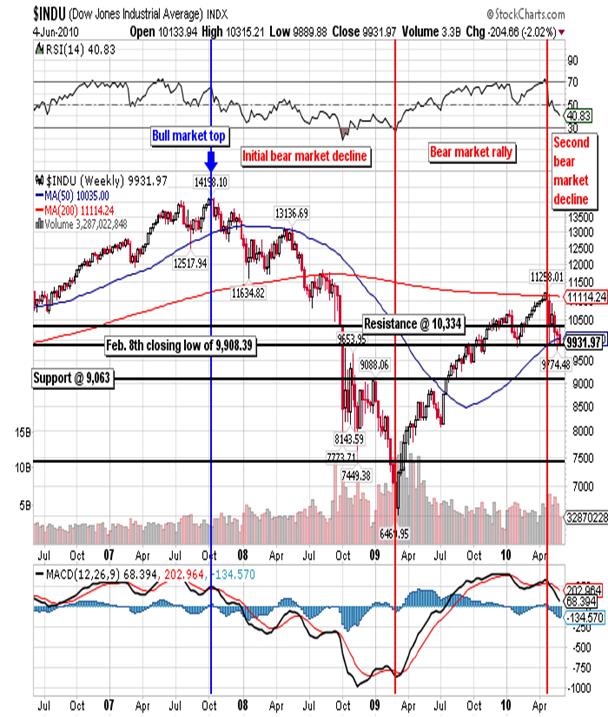
In the June 4th daily report I gave my reasons for selling the Dow short, but with what I’ve said above I want to look at the Dow in depth. I have maintained that the Dow experienced a magnificent twenty-five year long bull market (1982 – 2007) with a top of 14,198.10 on October 8, 2007. The top was not all that hard to recognize as the Transports failed to confirm it, stocks were extremely overvalued, and RSI faded before the peak was reached. From there the Dow began an initial decline, slowly at first as experts called bottom after bottom, and then gained speed as fear finally took center stage. Selling reached a fever pitch by early 2009 and finally exhausted itself by March 8th of that same year. That concluded the initial leg down and many so-called experts declared an end to the bear market. This was a mistake partially attributed to ignorance combined with the fact that most analysts now living had never before seen an honest to God bear market like the ones experienced in 1907 or 1930.
Any analyst worth his salt knows that bear markets bottom when selling has exhausted itself as stocks become truly cheap while paying good dividends. Historically stocks are considered to be overvalued when the PER is above 17 and the dividend yield is below 4% while inversely they are considered cheap when the PER is below 7 and the yield is above 6%. By this measure stocks haven’t been cheap for thirty years and have been continually overpriced for well over a decade. Now if you listened to some of the bullshit, and that’s what it is, on Bloomberg today you would have heard a fellow tell you that the PER is at 16 and stocks are cheap. Well the truth is you can’t calculate the PER for either the Dow or the S & P since too many of the companies are losing money. When stocks bottomed in March 2009 they still weren’t cheap, and as they began to climb higher something strange occurred, volume fell off considerably. That almost never happens in a bull market, but is a characteristic of a bear market rally. Never the less stocks ground their way higher with the Dow leading the way.
Throughout the reaction there were numerous occasions when the Dow would make a higher closing high and the Transports would fail to confirm. On occasion the Dow would make as many as seven or eight closing highs before the Transports would finally join in the parade. Then in mid-April of this year things changed as the Transports surged higher and the Dow began to falter. Finally, on April 26th the Dow made a closing high of 11,205.03 and then sputtered while the Transports may two more unconfirmed higher closing highs during the next five sessions. Also, it is worth mentioning that the RSI failed to confirm the closing high in the Dow. Another interesting attribute of the Dow’s recent decline was the fact that volume began to increase. All of this prompted me to declare that the Dow had topped and we were witnessing the beginning of the second leg down in a bear market that began back in October 2007, and absolutely no one was looking for it!
So I now believe that the primary trend remains down and the secondary trend has also turned back down. What makes me believe that this isn’t simply a reaction in a continuing trend higher? My reasons are the following:
- The Dow stopped its decline at 11,258.01 and that is almost exactly a Fibonacci 61.8% retracement of the initial decline.
- The weekly and monthly charts have all turned down.
- The initial decline was strong and then popped back up to test the 50-dma at 10,850 before turning lower again. The next reaction made a lower intraday low and then popped back up to test the 200-dma at 10,299 before turning back down. These tests produced a clear cut series of lower highs and lower lows.
- Volume on down days is consistently higher than volume on up days indicating distribution is occurring. Distribution is almost always a sign of a bear market.
- The decline has exceeded 10% indicating a change in trend and not just a simple reaction in a continuing move up.
- We’ve had numerous 90% down days with follow through to the downside while the few 90% up days have had absolutely no follow through to the upside.
I could go on but I think you get the idea. This market has turned down, the reason why is unimportant, and it will now do as much damage as possible.
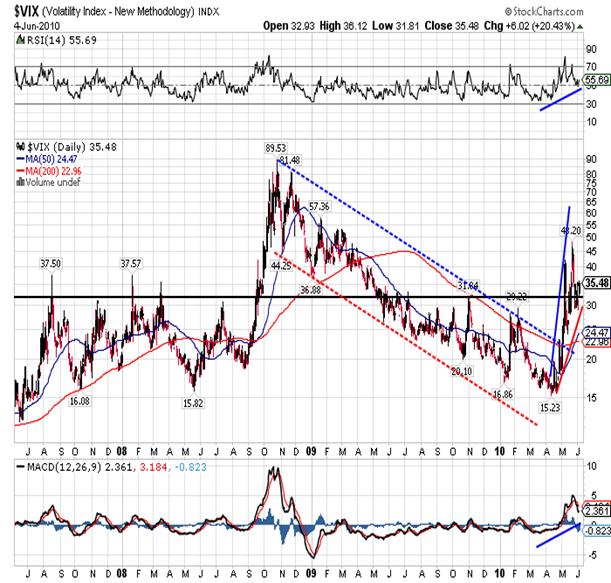
It is important to understand just what kind of a top we are making. Many analysts are looking for a head-and-shoulders top, feeling that the market needs time to distribute stock, but I disagree. If this were a bull market top I would go along with the idea of distribution, but this is a top in a secondary reaction. The market has already priced in a bear market and the smart money is long gone from this market. I believe the move down will be quick and violent, and as evidence to that you need to do is recall what happened on May 6th when the Dow fell 800 points in less than an hour. For a brief period of several minutes, there were no buyers anywhere! That tells me the need to distribute is not there; only suckers are holding on to stocks right now as they cling to the hope that somehow things will work out. Hope is a real killer in the investment world. There is one ingredient missing though, and that is fear. As you can see in this chart of the Volatility Index (VIX), we are laying the groundwork for the introduction of fear into the market place, but it’s not quite there yet. You can see the initial spike up after the May 6th surprise, but then things settled down as we learned of the “erroneous trade” and received assurances that all was right with the world. Now we see that the VIX is creeping higher after staying at or above good support at the 31.85 area, and we can also see that the 50-dma has now crossed back above the 200-dma for the first time since the bear market bottom of March 2009.
So here we are with the second leg of a bear market decline now underway and we need to know what to do. As an example on Thursday I sold short two September Dow futures contracts (DJU10) at 10,210 in a trading account that I established with US $50,000. This required a margin of US $16,000 so that left me with US $34,000 in liquidity for any other operations that I so desire. The September Dow closed out the week at 9,840 which implies a paper profit of US $3,700/contract or a total paper profit of US $7,400 as of the close of business on Friday. Right about now the traders out there are thinking that it would be the right time to head for the door, but I am not a trader and I’m not looking for a quick buck. I believe we are in a vicious bear market as a result of deflationary forces, a bear market the US government will not even acknowledge, and as a result the Dow will test the March 2009 low sometime later this year and will eventually test strong support at 3,572 sometime in 2011.
I want to be there when that happens, I want these contracts in my portfolio (I’ll roll them over at some point), and I want every penny of that profit in my account. I am more than willing to risk US $7,000 in order to get that reward and I am even willing to risk a run-up to the 10,725 resistance in order to achieve my goal. If I am right and the market drops over time, I will add on to my short position, very carefully I might add. I
SUPPORT RESISTANCE
SPOT DOW 9,706 10,334
9,461 10,725
9,063 11,245
8,401
7,470
should also say that I have certain numbers in mind and I have highlighted them above. Right now I am looking for a close below the 9,706 at which point I will sell short one more contract, probably December if I can get a decent fill. At the other three levels (9,063, 8,401, and 7,470) I will more than likely sell two contracts each. I should add that I know there will be reactions and some of them will be violent and I won’t like it, but I will not deviate (liquidate) from my chosen path. I know the market can become extremely overbought, but I don’t care. I will sit on my positions until I believe the bear market has run its course. This is the only way I can show you the one right way to make money in this type of environment.
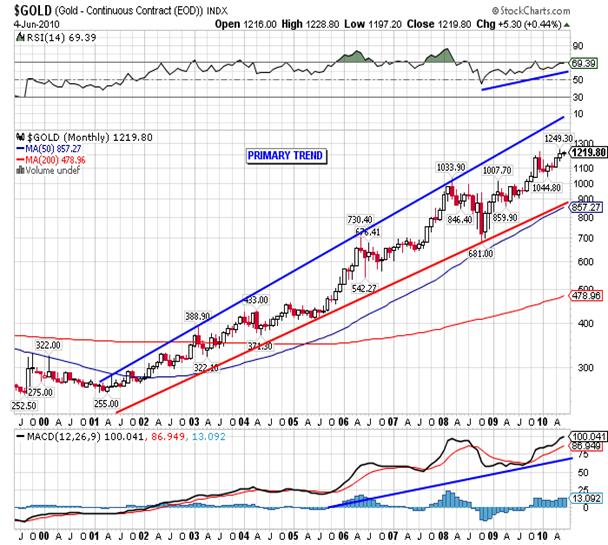
In the June 4th report I also mentioned that I bought one December gold futures contract (GCZ10) at the market, and the fill turned out to be at 1,210.00. Friday’s close in the December contract was at 1,221.80 implying a paper profit of 1,180.00. Under normal circumstances I would have bought gold on a new closing high, but since I am treating this and an initial position in a new portfolio, the point of entry is not relevant! That’s right; I said it’s not relevant. I have received tons of e-mails telling me that I am negligent in my failure to inform clients to abandon their positions and run for the hills. The general message is that I’m stupid by not selling in May and going away. Once again, bullshit! Right now the primary, secondary and tertiary trends of gold are all headed higher and the price continues to consolidate above the last previous significant high. What’s more every attempt to sell the yellow metal off, i.e. intervention, is met with buying. Only a fool sells when the market is telling you that you are correct. Below I have highlighted the primary trend:
and the secondary trend:
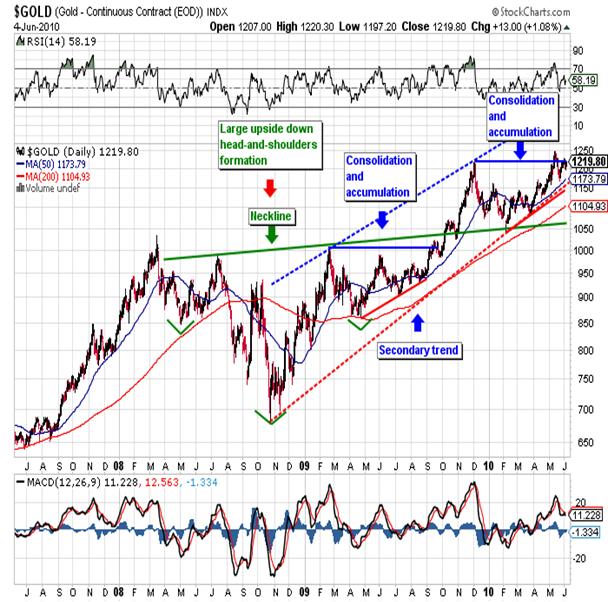
and I don’t think there is any argument as to the current direction. What’s more the second chart highlights two significant areas of consolidation/accumulation that combined run almost sixteen months. The gold market did not build such a strong base to make a marginally higher all-time high and then close up shop for the summer.
On Friday we saw a typical example of why you can’t trade the gold market. The August gold traded up as high as 1,220.00 during the night and then sold off early in the New York session, trading as low as 1,198.00 before buyers intervened. There were stops run at 1,204.00 and that forced weak longs to cover and some even went short. After bottoming gold immediately went back up to the 1,206.00 area, and then ran all the way up to the 1,217.70 close. What’s more the spot price rallied another 3.00 after the New York futures market went home for the weekend. The average trader more than likely got stopped out twice and went home for the weekend talking to himself. What most people don’t realize is that gold is a highly manipulated market with links to other manipulated markets like the FX and Dow. When the Dow looks bad they’ll try to cap gold in an effort to create the illusion that there are no problems and/or no alternatives to stocks.
Finally, if you take a look at the following daily chart for gold, you’ll see that the tertiary trend for gold is up as well:
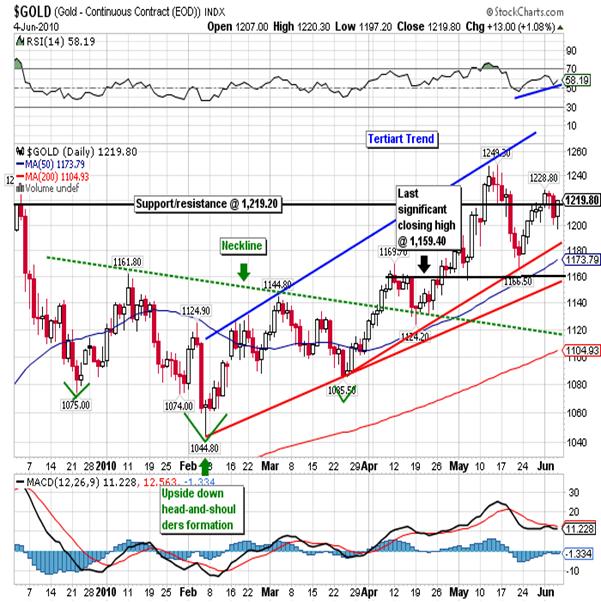
Here we not only see the presence of yet another upside down head-and-shoulders formation, but even more bullish is the fact that the tertiary trend has carved out a series of higher highs and higher lows, and the last reaction consolidated above the last previous significant closing high at 1,159.40. Friday’s close was above the significant Fibonacci number at 1,219.20 and also showed a gain for the week in spite of all the dire predictions for doom and destruction in the gold pit. As bullish as everything looks, gold is not overbought and we have a built a strong base for further movements to the upside. As a result I maintain my price target of 1,372.80 by the fall of this year and I think it’s possible that gold could reach 1,500.00 sometime this year. Therefore I will sit on my recent acquisition and look to add on once I see a new closing all-time high.
The only thing left to say is that as bullish as I am about gold, I am that bearish about commodities. So accordingly on Friday I had to act on my beliefs and sell short copper. Specifically I sold short one July copper futures contract at 2.93 in the morning and was fortunate enough to watch it fall apart into the close. It ended the week at 2.82 and has now broken down technically. This is my first adventure into commodities in a long time so it is a “probe” in order to ascertain if my timing is correct, or if I’m too early. I know I’m right in the Dow and gold, but I want the market to tell me I’m right in copper so I tread lightly. Do you see the difference? I chose copper because it was the least beaten up of the commodities, and in my opinion has the furthest to fall.
I am convinced that commodities have a lot of downside because we are in a situation where the world is awash in oversupply and overproduction of just about everything. On top of that all the major economies are deflating creating a vicious downward cycle that is beginning to feed on itself. China is the major buyer and has significant stock piles so they won’t by buyers anytime soon. Therefore copper must fall. I was waiting for a break below the 306.20 support and when I saw it, I decided to sell it short. Right
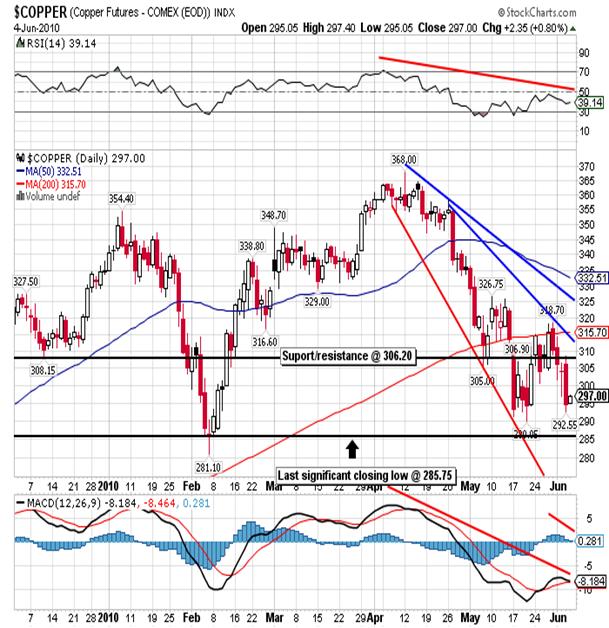
Right now there is nothing to do but watch and wait for the market to tell me if I am right, or indicate that I’m too early. I suspect I am right but a confirmation will come if and when it closes below the last significant low on February 6th at 285.75, and we’re not all that far away. Once that happens, I will let you know where I’ll add on. Finally, note the similarities between this chart and a daily chart for the Dow covering the same period of time. They are almost identical and that is no accident! As the Dow goes, so goes copper.
In conclusion, I believe the final chapter is already written and it’s a terrible ending. Many are convinced that the Fed and the Department of the Treasury will come out with a new, bigger and better bailout, and I have no doubt that the will. I am also convinced that it will be a huge failure for the simple reason that the market will take this as a colossal admission of failure. You can’t come out will an even larger bailout after you’ve already patted everybody on the back and declared victory. Europe just tried it and it failed miserably. It will be even worse when the US tries it and the markets will fall even harder. From here on out, any and all government intervention will only serve to drive home the notion that you’ve been defrauded and you have no recourse. People are now beginning to catch on and they are expressing their displeasure.
On Friday there were disturbances in the streets of Chicago, hardly a hotbed of political activism, and none of it came out in the press. Perhaps even more importantly is the fact that Chicago is in Obama’s home state!
So far the demonstrations are orderly, but sooner or later things will boil over, tempers will flair, and blood will be spilled. Americans are about to come to the realization that their future, their children’s future, and perhaps even that of their children’s children has been severely retarded. This will not set well. Those in power will try to repress the rebellion, but they’ll eventually lose in the long run. What emerges from the ashes is another question altogether. The last time we had a significant economic downturn we saw Hitler and Stalin come to power, and that led to war. I suspect war is in our future, and not the Iraq/Afghanistan type of war that we’ve blocked out of our mind. Rather we’ll see pissed off people talking on two-way radios and blowing up what’s left of the US infrastructure, one small chunk at a time, until they’ve been satisfied. That will be interesting to say the least.

PORTFOLIO SUMMARY
CONTRACT ACTION # INITIAL PRICE CLOSING PRICE GAIN
Sept Dow Short 2 10,210 9,840 7,400
Dec Gold Long 1 1,219.0 1,221.8 1,180
July Copper Short 1 293.0 282.0 550
In every weekend statement I will include the portfolio at the end of the report so you can follow the progress. Likewise if I add something during the week, I will update the portfolio in that particular daily report. Remember that these are positions put on for the long haul.
Go to www.stockcharts.com and enter free charts. Enter the symbol $INDU and you’ll see the daily chart for the Dow.
[Please note that the new website at www.stockmarketbarometer.net will become operational this week. Also, note that you can contact us at our new e-mails, info@stockmarketbarometer.net (general inquiries regarding services), team@stockmarketbarometer.net (administrative issues) or analyst@stockmarketbarometer.net (any market related observations).]
By Steve BettsE-mail: analyst@stockmarketbarometer.net
Web site: www.stockmarketbarometer.net
The Stock Market Barometer: Properly Applied Information Is Power
Through the utilization of our service you'll begin to grasp that the market is a forward looking instrument. You'll cease to be a prisoner of the past and you'll stop looking to the financial news networks for answers that aren't there. The end result is an improvement in your trading account. Subscribers will enjoy forward looking Daily Reports that are not fixated on yesterday's news, complete with daily, weekly, and monthly charts. In addition, you'll have a password that allows access to historical information that is updated daily. Read a sample of our work, subscribe, and your service will begin the very next day
© 2010 Copyright The Stock Market Barometer- All Rights Reserved
Disclaimer: The above is a matter of opinion provided for general information purposes only and is not intended as investment advice. Information and analysis above are derived from sources and utilising methods believed to be reliable, but we cannot accept responsibility for any losses you may incur as a result of this analysis. Individuals should consult with their personal financial advisors.
© 2005-2022 http://www.MarketOracle.co.uk - The Market Oracle is a FREE Daily Financial Markets Analysis & Forecasting online publication.