


Stock Market Internals Are Pre Crash Unhealthy, Sitting on a Precipice
Stock-Markets / Financial Crash Jun 13, 2010 - 07:13 AM GMT

 Stocks sit this weekend at the precipice. Conditions are ripe for a waterfall decline. This does not mean there will be a crash starting over the next few weeks, so please do not go out and short the farm. What we can tell you is the risk of one occurring is higher than normal, that conditions that preceded prior stock market crashes exist right here and now.
I believe that short-term we are now in a high probability zone for a stock market crash. Further, I believe this catastrophic Supercycle wave (C) down leg of the Grand Supercycle Degree Bear Market that started in 2007 will see a series of stock market crashes over the next 3 to 5 years. Further, I believe that when all is said and done, the Industrials, the S&P 500, and most major domestic and international stock indices will be near the value zero. This belief is based upon the technical analysis patterns and indicators that we follow, and is not some wild speculative opinion. This is dangerous ground we stand on this weekend.
We have been waiting and watching for a Hindenburg Omen to surface, that would warn of a possible stock market crash. We have not had a stock market crash over the past 25 years without an H.O. However, we noted several months back in these pages that it is going to be very hard to get a Hindenburg Omen until deep into 2010 because prices had risen so far, so fast above a year earlier's lows that it would be nearly impossible to see the requisite number of New 52 Week Lows on the NYSE to appear at the same time we get the requisite number of New Highs. We posited that did not mean a stock market collapse could not occur without an H.O. this time, that this time could be the exception to what we have seen over the past 25 years.
But a fascinating development has arisen that identifies a similar condition in the market that the Hindenburg Omen does, which increases our belief that in fact we could see a stock market crash start and continue over the next several months. The whole point of the Hindenburg Omen, the essence of what it is about, is to identify an unhealthy market, on the brink. I will quote Peter Eliades of stockcylces.com in his assessment of why a Hindenburg Omen identifies dangerous stock market conditions: "The rationale behind the indicator is that, under normal conditions, either a substantial number of stocks establish new annual highs or a large number set new lows -- but not both."
When both new highs and new lows are large, "it indicates the market is undergoing a period of extreme divergence -- many stocks establishing new highs and many setting new lows as well. Such divergence is not usually conducive to future rising prices. A healthy market requires some semblance of internal uniformity, and it doesn't matter what direction that uniformity takes. Many new highs and very few lows is obviously bullish, but so is a great many new lows accompanied by few or no new highs. This is the condition that leads to important market bottoms."
Now pay careful attention to Peter's thinking. He is absolutely right. An H.O. is not magic. It is a reasoned indicator that identifies a deeply unhealthy market that is not conducive to future rising prices.
Well, get this: There is another indicator we follow every day which has spelled out the precise market condition as a Hindenburg Omen identifies. That is the number of 90 percent up days and 90 percent down days we have seen over the past seven weeks. Are ready for these stats? Amazing. Since April 16th, 2010, there have been eight 90 percent down days and five 90 percent up days. 90 percent days are panic buying or panic selling days. This is highly unusual market action. And it indicates as Peter says about the H.O., "the market is undergoing a period of extreme divergence . . . And such divergence is not usually conducive to future rising prices. A healthy market requires some semblance of internal uniformity, and it doesn't matter what direction that uniformity takes."
Do you see? The high number of 90 percent up days interspersed over the past seven weeks is botching up the uniformity we would see in a normal corrective downtrend -- which would be a good thing for the market because it means a base building bottom is approaching. But there is not any uniformity to the decline from April 16th. Panic selling followed by panic buying followed by panic selling, etc... In other words, we now have the precise condition necessary for a stock market crash to occur over the next few months. This market has flies on it.
The most the Central Planners can hope for is an orderly decline over a period of weeks or months instead of a couple days of flash crashing. But a couple days of flash crashing where prices drop 2000 points over a few days cannot be ruled out. We believe that by the end of 2010, we would have seen stock prices fall at least 20 percent below where they are this weekend. There will be bounces along the way, but we have entered a period of time where lower lows and lower highs will occur, and that period of time could last several more years, into the 2012 to 2014 time period.
You can read an article on the theory and history of the Hindenburg Omen in our Guest Article section at www.technicalindicatorindex.com
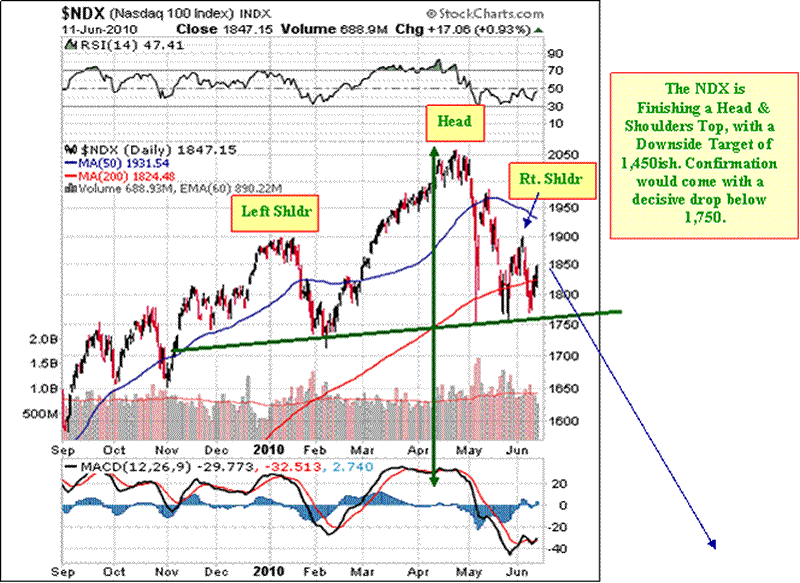
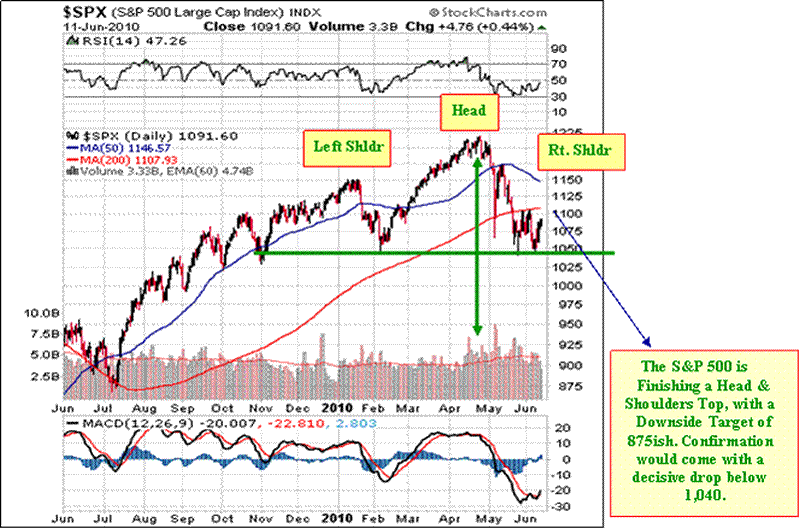
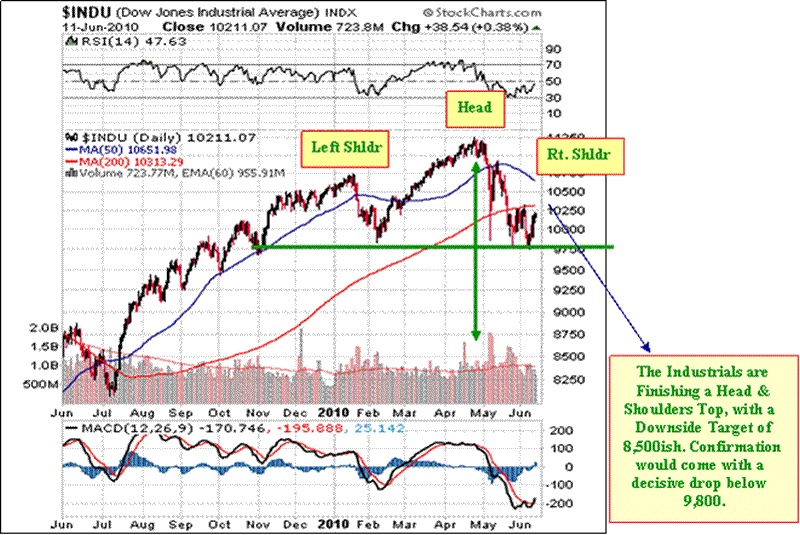
There are several other troubling developments at this time: Head & Shoulders tops that started back in November 2009 in the major U.S. market averages are nearing completion with downside targets that require a crash to get there. This weekend, we show in our newsletter to subscribers at www.technicalindicatorindex.com something else that is interesting, a possible fractal pattern of the decline from October 2007 through 2009 may be occurring from mid-April, that is a declining wedge with a waterfall conclusion.
Check out our June Specials, good through Sunday, June 6h, 2010, including a fabulous 13 month offering, only $259, a little under $20 a month, or 2 years for only $459 at www.technicalindicatorindex.com. We added a 3 months for $89 budget friendly deal this week.
If you would like to follow us as we analyze precious metals, mining stocks, and major stock market indices around the globe, you can get a Free 30 day trial subscription by going to www.technicalindicatorindex.com and clicking on the Free Trial button at the upper right of the home page. We prepare daily and expanded weekend reports, and also offer mid-day market updates 3 to 4 times a week for our subscribers.
“Jesus said to them, “I am the bread of life; he who comes to Me
shall not hunger, and he who believes in Me shall never thirst.
For I have come down from heaven,
For this is the will of My Father, that everyone who beholds
the Son and believes in Him, may have eternal life;
and I Myself will raise him up on the last day.”
John 6: 35, 38, 40
by Robert McHugh, Ph.D.
technicalindicatorindex.com
Robert McHugh Ph.D. is President and CEO of Main Line Investors, Inc., a registered investment advisor in the Commonwealth of Pennsylvania, and can be reached at www.technicalindicatorindex.com.
The statements, opinions, buy and sell signals, and analyses presented in this newsletter are provided as a general information and education service only. Opinions, estimates, buy and sell signals, and probabilities expressed herein constitute the judgment of the author as of the date indicated and are subject to change without notice. Nothing contained in this newsletter is intended to be, nor shall it be construed as, investment advice, nor is it to be relied upon in making any investment or other decision. Prior to making any investment decision, you are advised to consult with your broker, investment advisor or other appropriate tax or financial professional to determine the suitability of any investment. Neither Main Line Investors, Inc. nor Robert D. McHugh, Jr., Ph.D. Editor shall be responsible or have any liability for investment decisions based upon, or the results obtained from, the information provided. Copyright 2008, Main Line Investors, Inc. All Rights Reserved.
Robert McHugh, Ph.D Archive |
© 2005-2022 http://www.MarketOracle.co.uk - The Market Oracle is a FREE Daily Financial Markets Analysis & Forecasting online publication.