


Gold, GLD, GDX and SLV, Does November 2009 Repeat in July 2010?
Commodities / Gold and Silver 2010 Jun 26, 2010 - 09:14 AM GMTBy: John_Townsend

 Last week I offered some analysis using the True Strength Index indicator on the daily and hourly charts of GLD, GDX and GDXJ. This week I would like to offer what I believe to be a realistic look at what could be headed our way in the upcoming month of July. The charts in this article were made using the publically available software at FreeStockCharts.com.
The best way to understand the big picture is to look at the big picture, so let’s do that. What follows is a weekly chart of GLD. I set the time frame back over a year and use the True Strength Index indicator below the weekly price data.
What you will notice is that the current setup for GLD is practically identical to that which existed in November 2009. Not only can we say that of the price movement, but also the movement of the green colored True Strength Index (TSI) indicator below price.
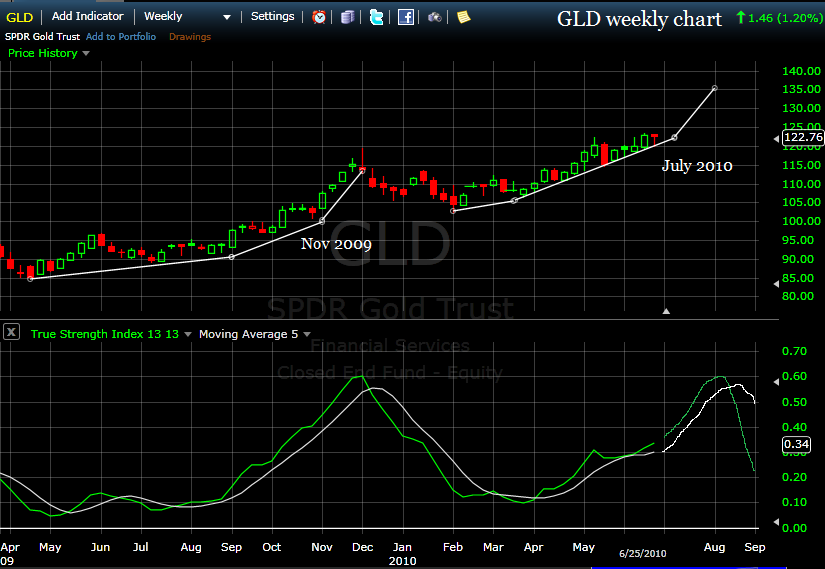
I have taken the liberty of hand drawing the green TSI indicator line and its accompanying white 3 week moving average with what I believe may be the likely outcome in July. I have also drawn straight white trend lines under price and attempted to render its possible direction for next month, as well.
One of the things I will be looking for in the upcoming weeks is whether or not the green line fails to continuously make new highs. Any failure to do so will spell likely failure of the potential parabolic pattern.
The other thing I will look for is the relative distance between the green TSI line and its white moving average counterpart. If the green momentum indicator gets too far apart, a pull back in price will occur. For example, one can observe in the GLD chart above that this is precisely what happened during the latter weeks in May.
If the pullback is mild, lasts only a week, maybe two, and does not violate the 3 week moving average, the parabolic move can remain intact. And by the way, this price scenario – the red candle pull backs to the trend line - is when the bull throws off a few of his overly emotional riders. Keep your eye on the bigger picture of the trend line and the TSI and you will ride the bull until he tires.
Next, let’s take a look at the miners as represented by the GDX ETF. On this weekly chart I also took the liberty of offering a hand drawn hypothetical outcome for the month of July.
I also offer some indicator measurement details to highlight how sell signals are given when negative divergences between price and the TSI occur.
The sell signal is simply this: when price makes a new high and the TSI concurrently makes a lower high, that is usually when the party is over.
I say usually because there is a scenario, seen in both the upcoming GDX and SLV charts, where a second rally occurs before heading into a painful correction.
The setup required for this to happen occurs when the TSI value is reading much much higher than ZERO.
Theoretically, the only time the TSI indicator is guaranteed to be correct on price heading south is when the indicator is BELOW zero. With the indicator far above the zero level but falling, there is time on the shot clock for another rally attempt, as the indicator will not fall from a very high reading to the zero line for some time. Rally attempts in this situation are simply doomed to fail. You will notice this occurred in the GDX chart below on the second week of January 2010.
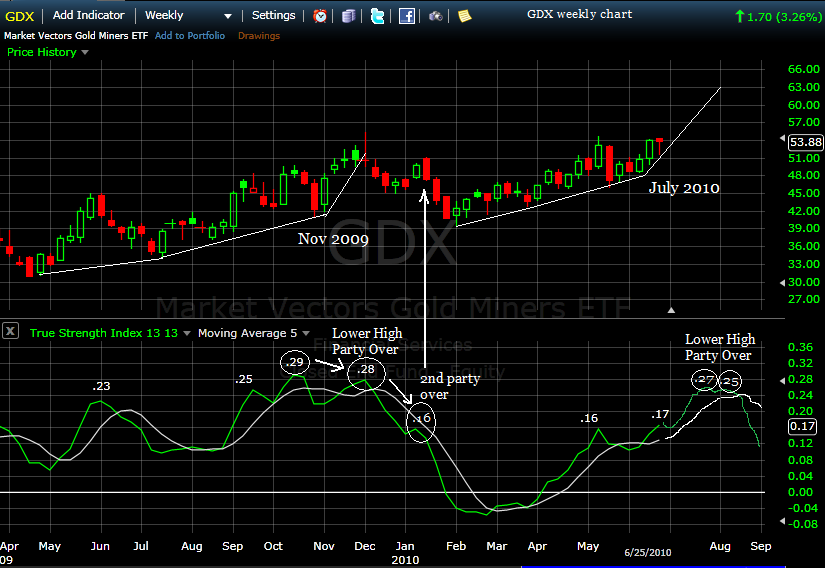
The key I will be eyeing for the next 4-6 weeks is whether the TSI continues to make higher highs. So long as it does, the rally still has legs. Today’s reading of .17 surpassed the high TSI reading of .16 six weeks ago, and that tells me GDX is still going higher.
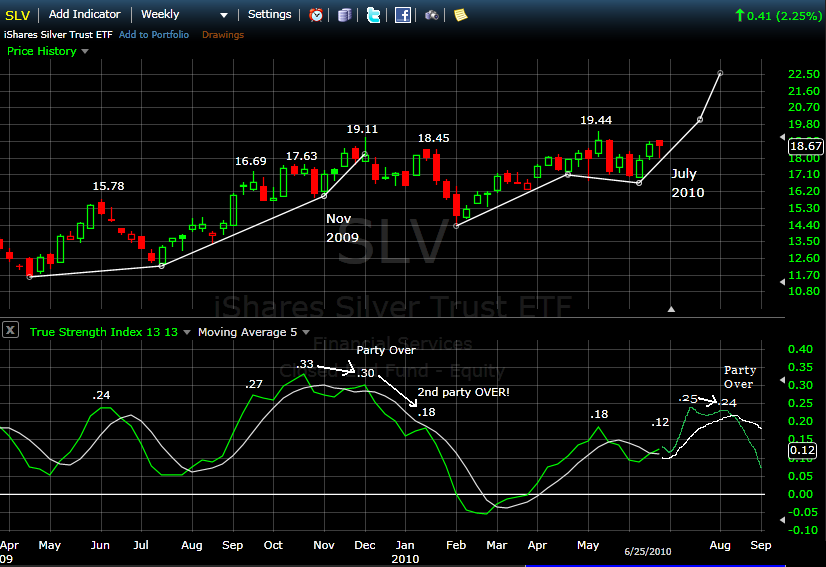
Now to SLV. Silver, from my True Strength Index understanding, has got itself in a tricky situation. The problem is that the last high reading was .18 and today’s reading is only .12. That means any higher high in price from here on out must be accompanied by a TSI reading in excess of .18, or it will be a negative divergence and create a sell signal.
To avoid this sell signal, either SLV is going to now trade sideways some, allowing the TSI to nudge higher while not scoring a new price high…… then SLV is going to have to put its foot to the pedal and simply scream higher week after week until the weekly TSI reading exceeds the previous high’s reading of .18.
This is the scenario I envision – some sideways movement, then a moon shot higher. But let me be the first to admit that my crystal ball is no better than anyone else’s.
I invite you to visit my website at www.theTSItrader.blogspot.com. I usually offer a few posts each day on my market observations, often comment on the particular stocks I am currently trading, and try to show ways to use the True Strength Index indicator to make some sense of where the precious metals and their miners are heading. You may comment at my blog or contact me at: TSItrader@gmail.com
Thank you for reading my thoughts. Please do not hesitate to share yours with me.
John Townsendmailto:TSItrader@gmail.com
© 2010 Copyright John Townsend - All Rights Reserved
Disclaimer: The above is a matter of opinion provided for general information purposes only and is not intended as investment advice. Information and analysis above are derived from sources and utilising methods believed to be reliable, but we cannot accept responsibility for any losses you may incur as a result of this analysis. Individuals should consult with their personal financial advisors.
© 2005-2022 http://www.MarketOracle.co.uk - The Market Oracle is a FREE Daily Financial Markets Analysis & Forecasting online publication.