


Double Dip Economic Recession, This Chart Say's Its Guaranteed!
Economics / Double Dip Recession Jun 28, 2010 - 11:38 AM GMTBy: JD_Rosendahl

 With all the incessant analysis from economists, politicians, and bureaucrats of this nascent recovery sprouting wings, there is one great and simple chart that's screaming a "Double Dip" is guaranteed: See the weekly chart of the $BDI below.
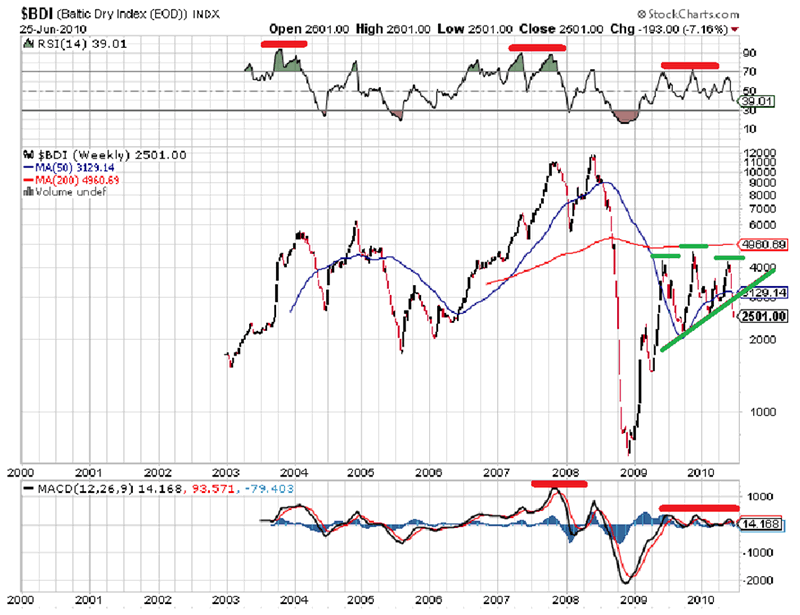
The index had made classic bearish divergences on both the RSI and MACD. It has also made a bearish head and shoulders topping pattern. The technical analysis of the index is screaming economic collapse on the way.
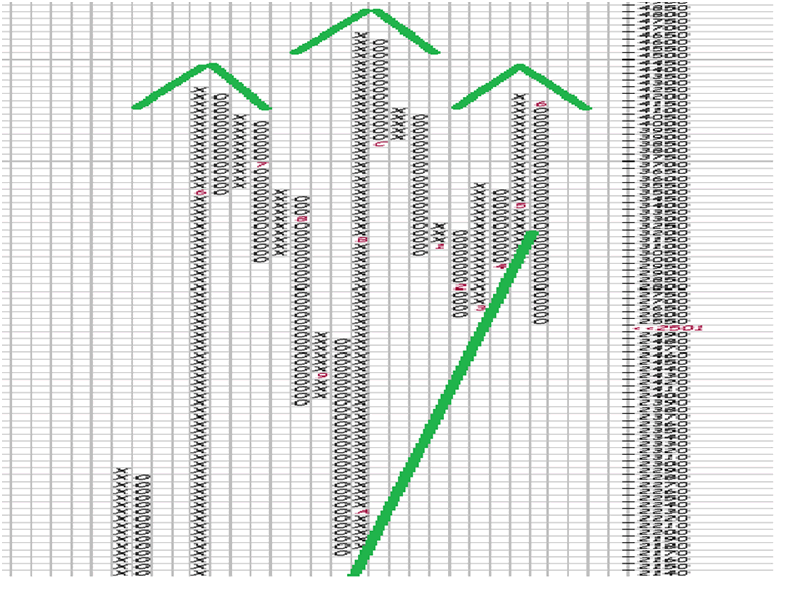
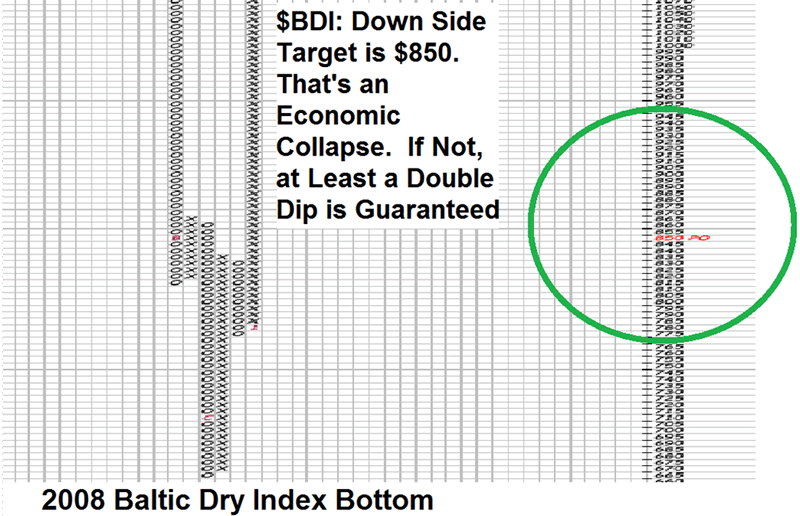
Below is the Point and Figure chart of the $BDI. The price Target is roughly a 65% correction from the current price of $2,500 to $850. That's also screaming economic collapse. Whether we get that dire of an economy or not, a "Double Dip" seems guaranteed.
What's the Baltic Dry Index?
The Baltic Dry Index is a daily average of prices to ship raw materials. It represents the cost paid by an end customer to have a shipping company transport raw materials across seas on the Baltic Exchange, the global marketplace for brokering shipping contracts. The index is quoted every working day at 1300 London time. The Baltic Exchange is similar to the New York Merc in that it is a medium for buyers and sellers of contracts and forward agreements (futures) for delivery of dry bulk cargo. The Baltic is owned and operated by the member buyers and sellers. The exchange maintains prices on several routes for different cargoes and then publishes its own index, the BDI, as a summary of the entire dry bulk shipping market. This index can be used as an overall economic indicator as it shows where end prices are heading for items that use the raw materials that are shipped in dry bulk.
The BDI is one of the purest leading indicators of economic activity. It measures the demand to move raw materials and precursors to production, as well as the supply of ships available to move this cargo. Consumer spending and other economic indicators are backward looking, meaning they examine what has already occurred. The BDI offers a real time glimpse at global raw material and infrastructure demand. Unlike stock and commodities markets, the Baltic Dry Index is totally devoid of speculative players. The trading is limited only to the member companies, and the only relevant parties securing contracts are those who have actual cargo to move and those who have the ships to move it.
Unlike stock and commodities markets, the Baltic Dry Index is totally devoid of speculative players. The trading is limited only to the member companies, and the only relevant parties securing contracts are those who have actual cargo to move and those who have the ships to move it. The BDI will show how much a company or country is willing to pay to import raw materials immediately. For example, if a Chinese company has contracted out coal prices for the next year from Rio Tinto (RTP), then the spot price of coal increasing after a mine accident will not impact that established contract. However, when this company is willing to pay more per ton to ship the coal than to actually purchase it, an investor can see that price growth is accelerating.
All the pundits in the world can chatter about what might be or could happen in their vacuum of economic analysis, but all you need to know is if this index continues to decline the world is in deep trouble.
It only stands to reason if the cost of shipping raw materials is going down its because there's less raw materials being shipped and there is greater supply of shipping available. If there's less raw materials being shipped it's because the global economy is declining because the pace of economic activity is shrinking.
It will be a global return to the bottom of 2008, maybe beyond. This chart is all you need to watch, the pundits are just noise.
Double Dip coming, bank on it!
Hope all is well.
By J.D. Rosendahl
www.roseysoutlook.blogspot.com
J.D. Rosendahl was a former stock broker/investment consultant (currently not licensed) before becoming a Commercial Banker for the past 14 years. He manages his family's wealth, helping them avoid the high tech bubble and the real estate bubble melt downs and preserving wealth.
© 2010 Copyright J.D. Rosendahl - All Rights Reserved
Disclaimer: The above is a matter of opinion provided for general information purposes only and is not intended as investment advice. Information and analysis above are derived from sources and utilising methods believed to be reliable, but we cannot accept responsibility for any losses you may incur as a result of this analysis. Individuals should consult with their personal financial advisors.
© 2005-2022 http://www.MarketOracle.co.uk - The Market Oracle is a FREE Daily Financial Markets Analysis & Forecasting online publication.