


Gold Technicals
Commodities / Gold and Silver 2010 Jul 27, 2010 - 01:00 PM GMTBy: Guy_Lerner

 This will be a comprehensive review of gold technicals utilizing the SPDR Gold Trust (symbol: GLD).
Figure 1 is a weekly chart of GLD with key pivot points. As we know, key pivot points are the most important areas of support (buying) and resistance (selling). With today's sell - off, GLD is below support levels at 115.07. Old support becomes new resistance. Support can be found at the 40 week moving average or more likely at the next levels of key pivot support at 108.5.
Figure 1. GLD/ weekly
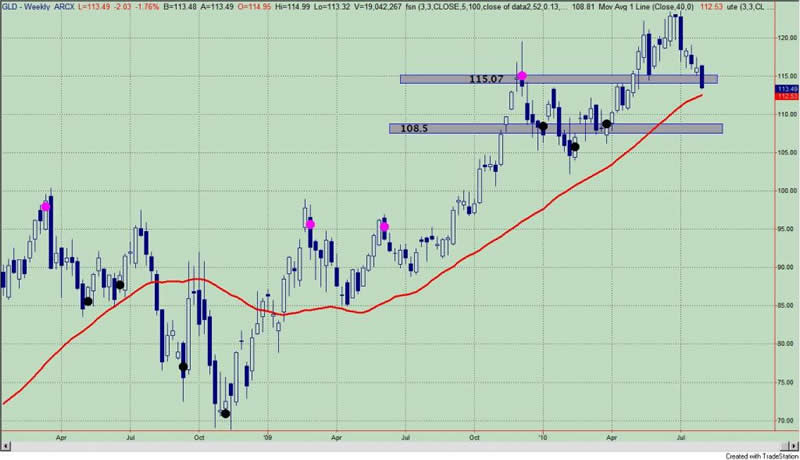
Figure 2 is a daily chart of GLD with key pivot points. For the better part of the past month, GLD has been breaking through support levels. Price is currently at the next level of support of 113.55. As prices are very oversold on the daily time frame, there is a good possibility of bounce back into old support (new resistance) levels between the zone of 115.49 (daily) and 115.07 (weekly).
Figure 2. GLD/ daily
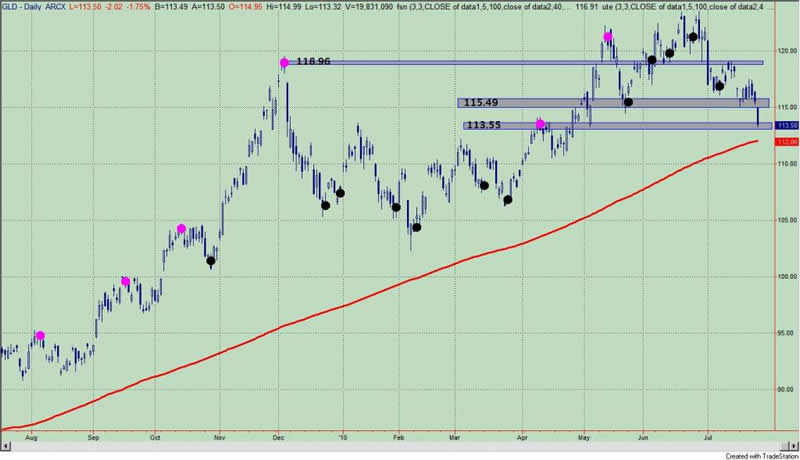
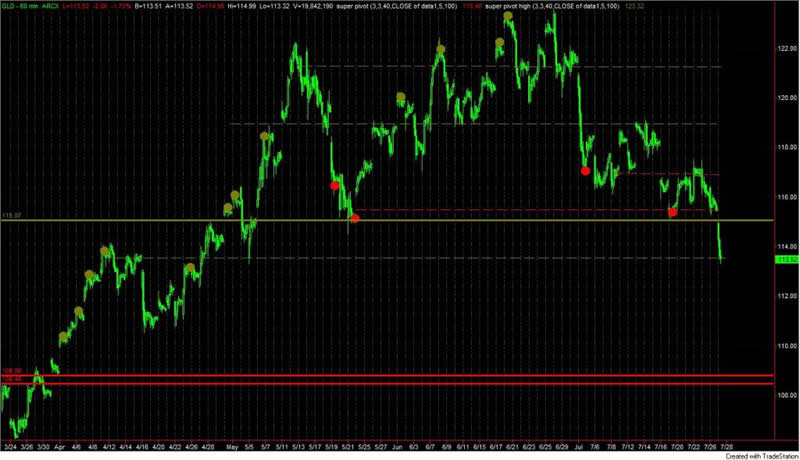
Figure 3 is a 60 minute chart of GLD; once again key pivot points are noted. The dashed lines are daily support and resistance levels (from figure 2) and the solid lines represent the key weekly levels. It is pretty clear from this shot that GLD has little support below the current levels. It is also worth noting that this looks a bit like an head and shoulder topping pattern. The neck line would be the current weekly resistance level. From the top of the pattern to the neck line is about 7 GLD points. Once prices bounce back to the neck line -remember we are oversold on the daily chart - look for another 7 point drop into the 108 support area.
Figure 3. GLD/ 60 minute
How concerning is this correction in gold and in GLD? If you are looking to buy GLD, these are the kind of corrections I would look for. Support levels get broken; stops are taken out and prices ricochet back in the other direction. This will be a good opportunity for those who have been patient.
But there is another interpretation and it doesn't have to do with gold. If I were an equity bull, I would be a little bit worried. Much of the recent equity story - that is why prices are higher today than 3 weeks ago - is built on the premise of a sustainable global recovery. Global recovery means copper is higher and oil is higher and yada, yada, yada. Yet when I look at prices today, I see both copper and oil trading into resistance and selling off modestly today. This kind of price action has me asking: is this a technical recovery, where a technical bounce in equity prices can only mean one thing - things are getting better or is this a fundamental recovery, where the improving fundamentals and economic outlook are driving prices higher? Once again, if all is good, why are gold and other commodities selling off?
Lastly, while on the topic of gold, I need to do a little housekeeping. First, our strategy of buying GLD on the presence of weekly negative divergence bars yielded a losing trade (a 1.4% loss), but that trade was closed about 7 trading days ago. Second, the Market Vectors Gold Miners ETF (symbol: GDX) is under pressure as I wrote about last week.
By Guy Lerner
http://thetechnicaltakedotcom.blogspot.com/
Guy M. Lerner, MD is the founder of ARL Advisers, LLC and managing partner of ARL Investment Partners, L.P. Dr. Lerner utilizes a research driven approach to determine those factors which lead to sustainable moves in the markets. He has developed many proprietary tools and trading models in his quest to outperform. Over the past four years, Lerner has shared his innovative approach with the readers of RealMoney.com and TheStreet.com as a featured columnist. He has been a regular guest on the Money Man Radio Show, DEX-TV, routinely published in the some of the most widely-read financial publications and has been a marquee speaker at financial seminars around the world.
© 2010 Copyright Guy Lerner - All Rights Reserved
Disclaimer: The above is a matter of opinion provided for general information purposes only and is not intended as investment advice. Information and analysis above are derived from sources and utilising methods believed to be reliable, but we cannot accept responsibility for any losses you may incur as a result of this analysis. Individuals should consult with their personal financial advisors.
Guy Lerner Archive |
© 2005-2022 http://www.MarketOracle.co.uk - The Market Oracle is a FREE Daily Financial Markets Analysis & Forecasting online publication.