


Is Consumer Spending 70% of GDP? Checkmark Recovery Revisited
Economics / Double Dip Recession Aug 03, 2010 - 02:03 PM GMTBy: Mike_Shedlock

 Inquiring minds are digging into the BEA report Personal Income and Outlays, June 2010
Personal Income
Personal income increased $3.0 billion, or less than 0.1 percent, and disposable personal income (DPI) increased $5.1 billion, or less than 0.1 percent, in June, according to the Bureau of Economic Analysis. Personal consumption expenditures (PCE) decreased $2.9 billion, or less than 0.1 percent.
In May, personal income increased $40.5 billion, or 0.3 percent, DPI increased $36.9 billion, or 0.3 percent, and PCE increased $8.6 billion, or 0.1 percent, based on revised estimates.
Wages and salaries
- Private wage and salary disbursements decreased $5.2 billion in June, in contrast to an increase of $19.2 billion in May.
- Goods-producing industries' payrolls decreased $8.9 billion, in contrast to an increase of $10.4 billion
- Manufacturing payrolls decreased $6.0 billion, in contrast to an increase of $7.8 billion.
- Services-producing industries' payrolls increased $3.7 billion, compared with an
- increase of $8.8 billion. Government wage and salary disbursements decreased $0.6 billion, in contrast to an increase of $7.0 billion.
- The decline in the number of temporary workers for Census 2010 subtracted $3.4 billion at an annual rate from federal civilian payrolls in June; the hiring of additional temporary workers had added $5.7 billion at an annual rate in May.
Personal Outlays
Personal outlays -- PCE, personal interest payments, and personal current transfer payments -- decreased $7.0 billion in June, in contrast to an increase of $4.6 billion in May. PCE decreased $2.9 billion, in contrast to an increase of $8.6 billion.
Personal Saving
Personal saving -- DPI less personal outlays -- was $725.9 billion in June, compared with $713.9 billion in May. Personal saving as a percentage of disposable personal income was 6.4 percent in June, compared with 6.3 percent in May.
For the most part, June took away some or most of the gains in May, depending on category.
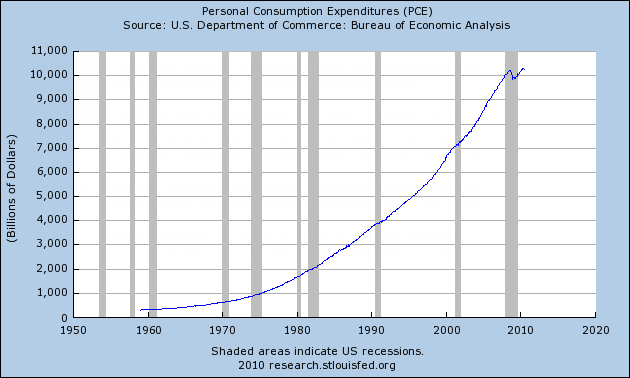
A few inquiring minds have asked me about Personal consumption expenditures (PCE). It is back to all time highs. Let's take a look.
PCE 1960 - Present
PCE 2000 - Present
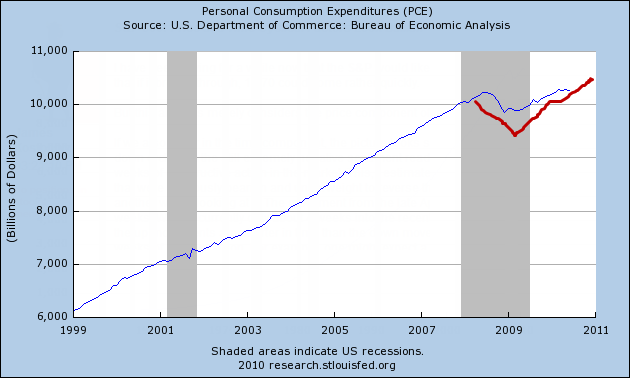
Has Consumer Spending Recovered?
One person cited the above chart as proof a "checkmark" recovery was in progress.
Others have asked about the chart, presuming that it shows consumer spending and retail sales have recovered.
The chart sure makes it look that way but that is not what is happening at all.
Indeed, state sales tax collections show dramatic declines in retail sales as noted in Did Retail Sales Rise or Did Tax Rates Go Up?.
A few days later the Rockefeller Institute Confirmed Rising Retail Sales a Mirage.
So if retail sales have been declining from 2008 through present (they are flat to slightly turning up now), then how do we account for the PCE chart?
Understanding PCE and Consumer Spending
To understand the discrepancy, we have to know what goes into PCE in comparison vs. retail sales. Here is an interesting article written in August of 2009 that addresses the issue.
Is Consumer Spending is 70% of GDP?
Economist Michael Mandel's article Consumer Spending is *Not* 70% of GDP not only addresses the above question, he also explains the apparent discrepancy between retail sales and consumer spending. Let's take a look.
I opened up this morning’s NYT and see the big headline “Retailers See Slowing Sales in a Key Season.” And I just know that we are about to have another round of “consumer spending is 70% of gross domestic product, so blah blah blah blah of course we can’t recover unless consumers start spending again.” (Not in the NYT story, to their credit, but you can find similar quotes everywhere you look).
Blah blah indeed. As a textbook author, there are few things that frost me more than hearing “consumer spending is 70% of gross domestic product,” because it perpetuates two very large and very misleading untruths.
First, the category of “personal consumption expenditures” includes pretty much all of the $2.5 trillion healthcare spending, including the roughly half which comes via government. When Medicare writes a check for your mom’s knee replacement, that gets counted as consumer spending in the GDP stats.
At a time when we are wrangling over health care reform, it’s misleading to say that “consumer spending is 70% of GDP”, when what we really mean is that “consumer spending plus government health care spending is 70% of GDP.”
Second, an awful lot of those back-to-school dollars are going to imported clothing and school supplies (how many of those laptops and iPods do you think are made in the U.S.?). A dollar of consumer spending does not translate into a dollar of domestic production.
In fact, the whole way that the BEA presents the GDP statistics points the public debate in the wrong direction. GDP stands for “gross domestic product”—that is, domestic production. But the breakdown of GDP is into expenditures categories—personal consumption expenditures, government consumption expenditures, etc.
I think we need to move towards presenting GDP in terms of production, rather than spending. We need a shift from the consumer to the producer as our main unit of analysis.
But for now, we need to stop being so darned obsessed with consumer spending.Why Consumer Spending Is Important
I disagree with Mandel's last statement because sales tax revenues are extremely important to state budgets.
However, Mandel's excellent article helps explain many things even alleged "productivity" issues of the US vs. Europe.
Productivity Issues Yet Again
The issue of productivity came up twice recently, the first time in Blog Wars? No, Hopefully Not - Just Temporary Insanity at Naked Capitalism Regarding Unions and a second time in Readers Chime in on Union Productivity.
The discussion of productivity was in response to an absurd article that supposedly Debunked the Notion that Unions Hurt Productivity, primarily based on a chart showing productivity to be higher in Europe.
Is productivity higher in Europe or are US health care costs distorting the picture? Certainly health care cost differentials is one of the things that wrecked US manufacturing.
Checkmark Recovery Revisited
Note too, that the more we spend on health care, the larger GDP is. The care does not have to be any good. Indeed, it isn't. The US spends more on health-care than any other industrialized nation, with nothing to show for it other than a PCE chart that makes it appear as if we have a "Checkmark Recovery".
Please see Disputing the Alleged "Checkmark Recovery" for further discussion.
By Mike "Mish" Shedlock
http://globaleconomicanalysis.blogspot.com
Click Here To Scroll Thru My Recent Post List
Mike Shedlock / Mish is a registered investment advisor representative for SitkaPacific Capital Management . Sitka Pacific is an asset management firm whose goal is strong performance and low volatility, regardless of market direction.
Visit Sitka Pacific's Account Management Page to learn more about wealth management and capital preservation strategies of Sitka Pacific.
I do weekly podcasts every Thursday on HoweStreet and a brief 7 minute segment on Saturday on CKNW AM 980 in Vancouver.
When not writing about stocks or the economy I spends a great deal of time on photography and in the garden. I have over 80 magazine and book cover credits. Some of my Wisconsin and gardening images can be seen at MichaelShedlock.com .
© 2010 Mike Shedlock, All Rights Reserved.
© 2005-2022 http://www.MarketOracle.co.uk - The Market Oracle is a FREE Daily Financial Markets Analysis & Forecasting online publication.