


A U.S. Treasury Bond Bubble? Not Likely!
Interest-Rates / US Bonds Aug 24, 2010 - 11:49 AM GMTBy: Guy_Lerner

 My thoughts on the bond bubble can be summarized in two words: "not likely". When commentators have to tell you it is a bubble, it isn't a bubble. Or to put this in another context, name me one market top in the last 10 years where the commentators on CNBC where not imploring their audience to buy at the top. If anything, the commentators have this aura of incredulousness. "How dare bonds head higher and stocks head lower. Doesn't everyone know how undervalued equities are?" When CNBC throws in the towel and when they utter those famous words - "is it to late to buy now?" - then we can consider the possibility of a bond bubble.
But let me clarify. Bonds may not be a great investment 10 years down the road, but over the next 6 months, let's say, it is difficult to see the current trend ending. Figure 1 is a weekly chart of the yield on the 30 year Treasury bond (symbol: $TYX.X) going back to 1987. The indicator in the bottom panel is a weekly derivation of the Coppock curve. The indicator (shown in red) is wrapped in trading bands that seeks to determine extremes over the prior 2 years of data. This is the same Coppock curve that equity bulls cited back in March, 2009 to suggest that a turn in the equity market was for real.
Figure 1. $TYX.X/ weekly
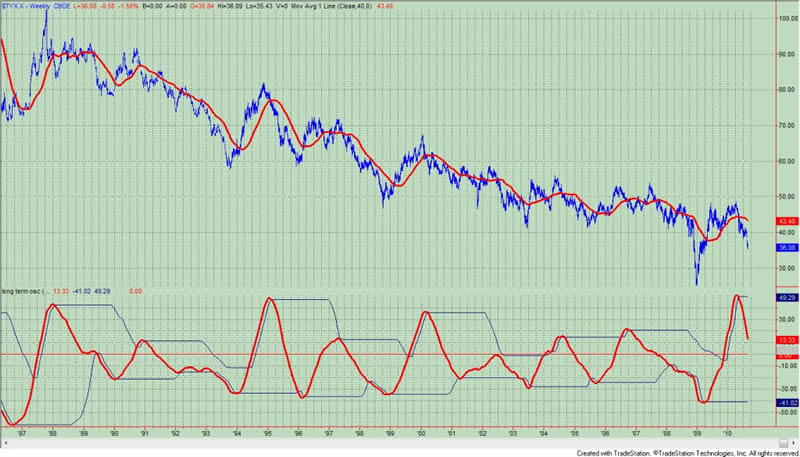
This is a very long term measure and it doesn't change direction too often or too quickly. Currently, the indicator is headed downward and well above the zero line and the lower trading band (where one would expect a reversal). In other words, once a trend is set in motion it tends to persist, and it appears that this trend has a ways to go before it ends.
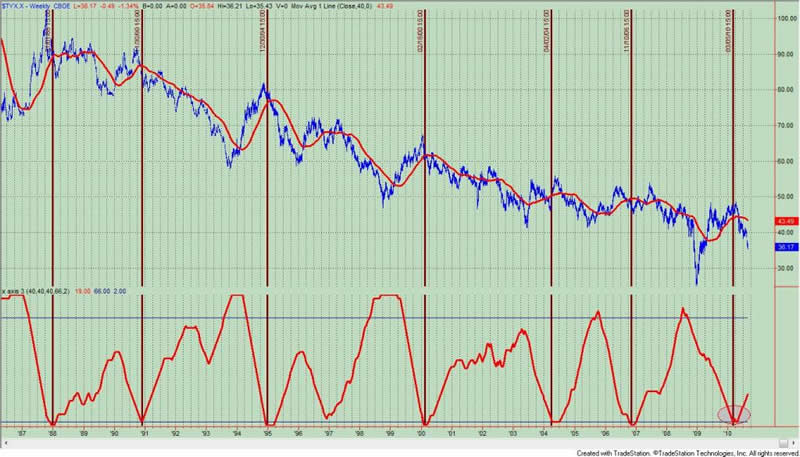
Another way to look at this can be seen in figure 2, a weekly chart of the yield on the 30 year Treasury bond. The proprietary indicator in the lower panel looks for market turns by assessing opening and closing prices relative to each other and past bars. This is another long term indicator. It was only 4 months ago (oval on the price chart) that this indicator suggested a top in yields was likely, and it would seem unlikely that this trend of lower yields has run its course so quickly.
Figure 2. $TYX.X/ weekly
By Guy Lerner
http://thetechnicaltakedotcom.blogspot.com/
Guy M. Lerner, MD is the founder of ARL Advisers, LLC and managing partner of ARL Investment Partners, L.P. Dr. Lerner utilizes a research driven approach to determine those factors which lead to sustainable moves in the markets. He has developed many proprietary tools and trading models in his quest to outperform. Over the past four years, Lerner has shared his innovative approach with the readers of RealMoney.com and TheStreet.com as a featured columnist. He has been a regular guest on the Money Man Radio Show, DEX-TV, routinely published in the some of the most widely-read financial publications and has been a marquee speaker at financial seminars around the world.
© 2010 Copyright Guy Lerner - All Rights Reserved
Disclaimer: The above is a matter of opinion provided for general information purposes only and is not intended as investment advice. Information and analysis above are derived from sources and utilising methods believed to be reliable, but we cannot accept responsibility for any losses you may incur as a result of this analysis. Individuals should consult with their personal financial advisors.
Guy Lerner Archive |
© 2005-2022 http://www.MarketOracle.co.uk - The Market Oracle is a FREE Daily Financial Markets Analysis & Forecasting online publication.