The Stock Market Has Become Fatally Expensive, Devaluation Wave Could Push Stocks To March 2009 Lows
Stock-Markets / Stocks Bear Market Aug 25, 2010 - 08:04 AM GMTBy: Claus_Vogt
 As I said in last week’s column, liquidity indicators and leading economic indicators have deteriorated quickly since March. At the same time sentiment indicators reached levels usually seen at stock market highs. All three are the main components of my forecasting model.
Now my model is presenting an even clearer message that the next recession and a bear market are in the offing. And we should expect a test of the March 2009 lows.
Moreover, I have massive doubts that these lows will hold, because …
The Stock Market Has Become Fatally Expensive
|
Forget about Wall Street’s misleading songs about cheap valuations. These analysts constantly use dubious figures, like estimated operating earnings, to come up with such evaluations. If you want history to be on your side, stick to time-honored valuation metrics such as 12-months trailing GAAP earnings or yearly dividend yields.
The latter are especially fitting because they cannot be manipulated whatsoever. The money distributed to share holders as dividends has to be real!
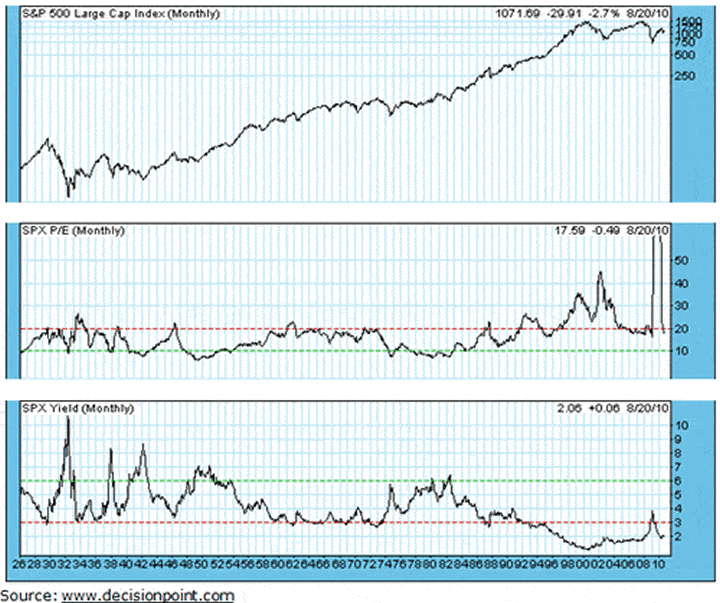
Just look at the long-term, S&P 500 chart below …
The middle panel shows the price/earnings ratio using 12-months trailing GAAP earnings. As you can see the market is at a relatively high 17.59. This is near the upper boundary of 18 to 20.
And the only time this boundary was drastically exceeded was during the stock market bubble years, and in 2008 when earnings went negative for the first time in U.S. history.
|
Dividend yields as shown in the bottom panel are at 2.06 percent and convey the same message: The stock market is expensive.
Stock market history holds another insight for us …
The market moves in long-term cycles from undervaluation to overvaluation and back again. After the bubble burst in 2000, the market never reached levels historically associated with undervaluation. Not at the depths in 2002 — not in March 2009.
Therefore, I fully expect the secular bear market that began with the bursting of the stock market bubble in 2000 to push valuations down to historically undervalued levels. That is single-digit P/E ratios and dividend yields around 6 percent or more.
And it could happen within the next 18 months, driving the indexes below their March 2009 lows.
Best wishes,
Claus
This investment news is brought to you by Money and Markets. Money and Markets is a free daily investment newsletter from Martin D. Weiss and Weiss Research analysts offering the latest investing news and financial insights for the stock market, including tips and advice on investing in gold, energy and oil. Dr. Weiss is a leader in the fields of investing, interest rates, financial safety and economic forecasting. To view archives or subscribe, visit http://www.moneyandmarkets.com.
© 2005-2022 http://www.MarketOracle.co.uk - The Market Oracle is a FREE Daily Financial Markets Analysis & Forecasting online publication.


