


The Great Debt Deleveraging Lie
Economics / US Debt Aug 26, 2010 - 05:54 PM GMTBy: James_Quinn

 You can't open a newspaper or watch a business news network without seeing or hearing that consumers and businesses have been de-leveraging. The storyline as portrayed by the mainstream media is that consumers and corporations have seen the light and are paying off debts and living within their means. Austerity has broken out across the land. Bloomberg peddled this line of bull last week:
US Household Debt Shrank 1.5% in the Second Quarter
American households pared their debts last quarter, closing credit card accounts and taking out fewer mortgages as unemployment persisted near a 26-year high, a survey by the Federal Reserve Bank of New York showed Consumer indebtedness totaled $11.7 trillion at the end of June, a decline of 1.5 percent from the previous three months and down 6.5 percent from its peak in the third quarter of 2008, according to the New York Fed's first quarterly report on household debt and credit. The report reinforces forecasts for a slowing economy in the second half of 2010 as consumers hold back on spending and rebuild savings.
One has to wonder whether the mainstream media and the clueless pundits on CNBC actually believe the crap they are peddling or whether this is a concerted effort to convince the masses that they have done enough and should start spending. Consumer spending as a percentage of GDP is still above 70%. This is well above the 64% level that was consistent between 1950 and 1980. Consumer spending was entirely propped up by an ever increasing level of debt. The American economy will never recover until consumer spending drops back to the 64% range that indicates a balanced economic system. For the mathematically challenged on CNBC and in the White House, this means that consumers need to reduce their spending by an additional $850 billion PER YEAR. Great news for the 1.5 million retailers in America.
Below is a chart that shows total credit market debt as a % of GDP. This chart captures all of the debt in the United States carried by households, corporations, and the government. The data can be found here:
http://www.federalreserve.gov/releases/z1/current/accessible/l1.htm
Total credit market debt peaked at $52.9 trillion in the 1st quarter of 2009. It is currently at $52.1 trillion. The GREAT DE-LEVERAGING of the United States has chopped our total debt by 1.5%. Move along. No more to see here. Time to go to the mall. Can anyone in their right mind look at this chart and think this financial crisis is over?
During the Great Depression of the 1930's Total Credit Market Debt as a % of GDP peaked at 260% of GDP. As of today, it stands at 360% of GDP. The Federal Government is adding $4 billion per day to the National Debt. GDP is stagnant and will likely not grow for the next year. The storyline about corporate America being flush with cash is another lie. Corporations have ADDED $482 billion of debt since 2007. Corporate America has the largest amount of debt on their books in history at $7.2 trillion.
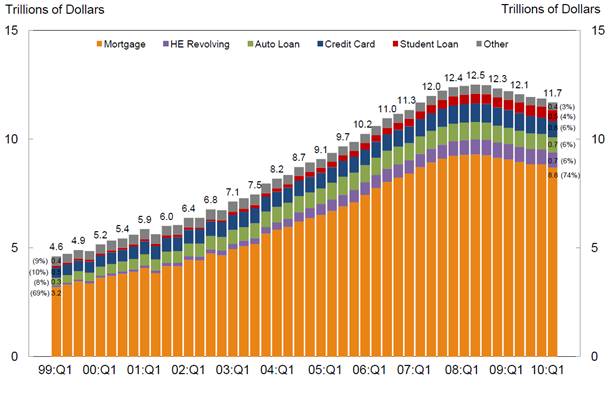
Now we get to the Big Lie about frugal consumers paying off debts, cutting up those credit cards, and eating Raman noodles 5 nights per week. Household and non-profit debt, which includes mortgages, credit card debt, auto loans, home equity loans, and student loans peaked at $13.8 trillion in 2008. After two years of supposed deleveraging, frugality and mass austerity, the balance is $13.5 trillion. Consumers have buckled down and have paid off 2.2% of their debts, it seems. Not exactly going cold turkey, but it is a start.
But wait. Consumer debt outstanding is $300 billion lower. If you hadn't noticed, the banks in the United States have been taking a few losses on their loans over the last couple years. A simple search of the Federal Reserve website reveals that banks have charged off 5.66% of all their loans in the last two years. The charge off rate in the 2nd quarter of 2010 was 6.66%. To verify for yourself go to the Federal Reserve website:
http://www.federalreserve.gov/releases/chargeoff/chgallsa.htm
So, let's get down to the nitty gritty. If consumer debt was $13.8 trillion at the end of 2008 and the banks have since written off 5.66% of that debt, total write-offs were $800 billion. If total consumer debt now sits at $13.5 trillion, then consumers have actually taken on $500 billion of additional debt since the end of 2008. The consumer hasn't cut back at all. They are still spending and borrowing. It is beyond my comprehension that no one on CNBC or in the other mainstream media can do simple math to figure out that the deleveraging story is just a Big Lie.
The truth is that the debt has simply been shifted from criminal Wall Street Banks to the American taxpayer. These consumer debts were created in a private transaction between individuals and these banks. When the loans went bad, the consumer should have lost their home, car, etc., and their credit rating should have been ruined, keeping them out of the credit market for a number of years. If the banks that made these bad loans made too many, they should have failed and had their assets liquidated in bankruptcy. Instead, the Federal Government has inserted the American taxpayer into the equation by using our tax dollars to prop up insolvent Wall Street banks and allowing screw-ups who took on too much debt to live in houses for over two years without making a mortgage payment.

The Big Lie will eventually lose out to the grim truth. America's economy is built on a debt based foundation of sand and the tide of reality is relentlessly eating away at that foundation of debt. Collapse is just a matter of time. The charts below from the Federal Reserve paint a grim picture of reality.
Total Debt Balance and its Composition
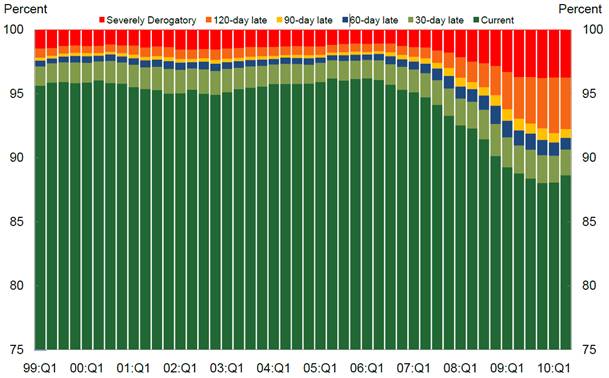
Total Balance by Delinquency Status
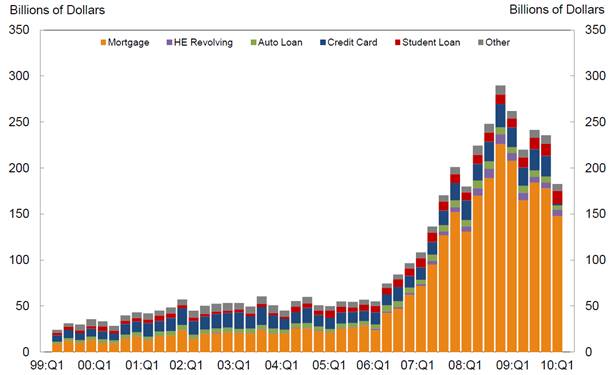
New Seriously Delinquent Balances by Loan Type
Join me at www.TheBurningPlatform.com to discuss truth and the future of our country.
By James Quinn
James Quinn is a senior director of strategic planning for a major university. James has held financial positions with a retailer, homebuilder and university in his 22-year career. Those positions included treasurer, controller, and head of strategic planning. He is married with three boys and is writing these articles because he cares about their future. He earned a BS in accounting from Drexel University and an MBA from Villanova University. He is a certified public accountant and a certified cash manager.
These articles reflect the personal views of James Quinn. They do not necessarily represent the views of his employer, and are not sponsored or endorsed by his employer.
© 2010 Copyright James Quinn - All Rights Reserved
Disclaimer: The above is a matter of opinion provided for general information purposes only and is not intended as investment advice. Information and analysis above are derived from sources and utilising methods believed to be reliable, but we cannot accept responsibility for any losses you may incur as a result of this analysis. Individuals should consult with their personal financial advisors.
James Quinn Archive |
© 2005-2022 http://www.MarketOracle.co.uk - The Market Oracle is a FREE Daily Financial Markets Analysis & Forecasting online publication.