


Gold Momentum Divergence Trend Warning - Technically Precious with Merv
Commodities / Gold & Silver Sep 23, 2007 - 04:02 PM GMTBy: Merv_Burak

 Staying with the trend can be profitable but is it time for the trend to end?
GOLD
Everybody's getting all excited because we are hitting new 27 year highs so I thought I'd show you what all the excitement is about. For technicians things are really getting hot. We have all sorts of projections based upon short, intermediate and long term charts, many of these projections you have read in these commentaries. What about the very long term, you might ask. You have heard about the $1600 projection but where does it come from? Well, here we have the very long term P&F chart that gets us there and possibly beyond.
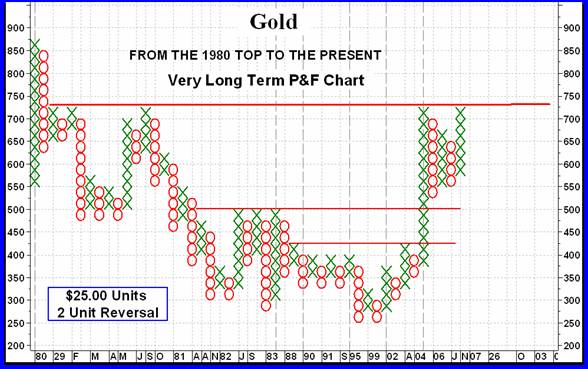
Just to run through a quick analysis of the very long term, since the 1980 top gold tried to recover later in the year but was stymied at the $725 resistance level. Since then gold did not provide us with a move on the very long term chart that broke two previous highs until very late 2003 when it hit $400. Since then it has been up hill with a recent lateral period.
Although we can make several projections from this chart the clearest ones are those whose resistance levels have a wall of O s on the left side. There are two such locations shown by the red lines and one potential. The first resistance break projected to the $1075 level. The second such resistance level break projected to the $1575 level (this is the simplified $1600 projection). The last, a resistance that has not yet been broken, would project to the $2575 level (let's say $2600) once the price of gold hits $750.
These are very long term projections and who knows when they will be reached, if they ever are. Depending upon the strength of the US $ and political instability around the globe these projections could occur within the next few years, or within the next few decades, or possibly never. Some technicians believe that time spend in a consolidation prior to the break out will be the time from the break-out to the projection. That would make it about the year 2020 for the first ($1075) projections. I'm not a great believer in these time forecasts, but who knows?
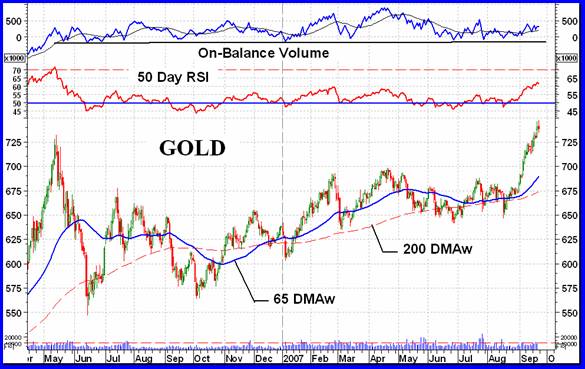
Looking at the normal charts and indicators it almost goes without saying that everything is looking rosy. The price action continues above its positive sloping moving average line, momentum continues to move higher in its positive zone and even the volume indicator is above its long term trigger line with the line having turned upwards. About the only cautionary indicator is still the momentum indicator. Although positive and having just exceeded its previous (April to June) highs it has still not exceeded its July 2006 high and is still far below its high from the May 2006 top. This continues to be a negative divergence since the price itself has exceeded its May 2006 top.
Despite the momentum negative divergence, which is a warning not a signal, I remain bullish on the long term.
INTERMEDIATE TERM
The intermediate term P&F chart continues to point straight up without a reversal of direction yet. Very bullish for now.
The normal chart and indicators, shown above, Show the recent straight up action into new highs with the moving average (65 DMAw) following in its trail. Unlike the long term momentum, the intermediate term momentum is climbing higher and has exceeded all its previous highs except for the one from the May 2006 top. This too is a negative divergence but as mentioned earlier, a warning not a signal. The volume indicator is also giving us a warning. Although above its intermediate term trigger line with the line turning upwards the indicator is having trouble moving upwards with any strength. It has not even exceeded its previous high from a few months back despite the price being considerably above its same period level.
The indicators, at this point, are all positive so I must remain bullish on the intermediate term.
SHORT TERM
“Going with the Trend in motion” continues to keep us in the right direction despite some indications of weakness behind the move. Most of the time one is best served by waiting for confirmation of a move, or of a reversal, before panicking.
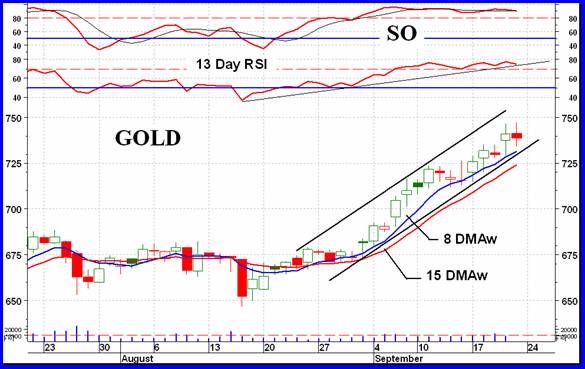
For over the past two weeks now the short term momentum (13 Day RSI) has been on a horizontal path inside its overbought zone. How long will it stay there is anyone's guess but it might not be for much longer. A drop below its overbought line would be a strong warning that the short term may be about to turn. I see the $720 level as the best guess for a short term reversal price. In the mean time we are still under the influence of a bullish trend.
IMMEDIATE TERM
To try and guess the next day or two action, following a week end when anything can happen, is just a flip of the coin. I will be omitting the immediate term after this week and these comments, when they are reasonable, will be covered under the short term label.
It's now over three weeks since the aggressive Stochastic Oscillator (SO) entered its overbought zone. It remains in the zone. It wouldn't take much to move it below its overbought line and that could precipitate the start of some down side action. A move below $727 should do it but in the mean time we are still seeing more upside ahead.
NORTH NAMERICAN GOLD INDICES
The five major North American Indices that I follow here all had good weeks with gains from 4.9% for the S&P/TSX Global Gold Index to 9.4% for the AMEX Gold BUGS Index. I'm not sure why the S&P/TSX Index is so far removed from the others (most were in the 8% level) unless the components are capped as to their weight towards the Index calculation and this comes into play. The S&P/TSX is still the only major that is some distance from its previous May 2006 top. The Gold Miners Index is also below its May 2006 top but only by a small fraction.
All of the majors are bullish on both the intermediate term (no surprise there) and all are showing weakness in their momentum indicators. None of the majors has yet reached the momentum level of the May 2006 top. A warning but in the mean time let's be happy with the trend.
MERV'S PRECIOUS METALS INDICES
The Composite Index of Precious Metals Indices zoomed into new high territory this past week although many of the component Indices are still some distance from their respective highs. Momentum, however, is very weak and has not exceeded any of its previous peaks even the most recent ones. Longevity of the new move is therefore in doubt. Looking at the table of technical indicators, other than the US$ Index, the only NEG rating for any time period is for the Merv's Spec-Silver Index which still has a NEG for the long term.
MERV'S GOLD & SILVER 160 INDEX
Well the overall universe didn't do so bad. The average stock in the universe advanced by 6.1%, not the best but okay for an average of 160 stocks. One might have expected a better performance when you have more than 4.5 times the advancing stocks versus the declining stocks. 127 stocks advanced (79%) while only 27 declined (17%). Going along with the weeks positive action is a further shift towards the positive of the summation of individual stock ratings. The short term is now rated as BULL 83%, the intermediate term is rated as BULL 58% but the long term is still lagging behind with a BEAR rating at 50%.
Looking at the charts and indicators we have everything in the positive but only very slightly so. However, positive it is so I am BULLISH intermediate and long term for this Index.
MERV'S QUAL-GOLD INDEX : MERV'S SPEC-GOLD INDEX : MERV'S GAMB-GOLD INDEX
Once again we find when looking over the weekly performances of the three “quality” sectors of precious metals stocks we find that the better performers were the highest quality stocks while the worst performers were the cats and dogs, the gambling variety. The second tier stocks are holding the middle. This is indicative of either one of two things. It could be the start of a new bull market in precious metal stocks.
At the start of new bull markets it's the quality issues that take the initial lead. Or it could be that the speculators and professionals are not yet sure of the market and are eliminating risk and going towards the quality, which they see as low risk. The problem with these two possibilities is that in the first case the speculative stocks will eventually come roaring from behind and far exceed the performance of the higher quality stocks. As for the second possibility, well it could just as likely be that the market will collapse and the speculative stocks will take the greatest bulk of the punishment. However, as I have noted in the past, if we get into a long bear market the quality lose just as much percentage wise as the speculative stocks do.
For now this is where we are. The Qual-Gold Index gained 8.0% on the week. The Spec-Gold Index gained 6.7% and the Gamb-Gold Index gained 4.9%. This move towards the quality is once more reflected in the winners and losers. The Qual had 97% winners and only 3% losers. The Spec had 80% winners and 20% losers while the Gamb had 67% winners and 20% losers As for the summation of ratings, well they all moved further towards the positive with only the Gamb-Gold Index intermediate and long term not yet in the BULL camp. They are NEUTRAL on the intermediate and still BEAR 63% on the long term. All other ratings are BULLISH.
As for the charts and indicators, they are all in the positive, even the Gamb-Gold moving averages and momentum just squeaked into the positive range. So, BULLISH for all Indices.
SILVER
Well finally silver bullion out performed gold. It was a rough time for silver over the past several months. Silver was accustomed to out performing gold for a couple of years then the reversal set in and gold gained ground. Over the past few weeks as the markets moved higher gold was out performing silver but this week it's the reverse. Is silver back on track to continue out performing gold? I don't know but it will be interesting to watch.
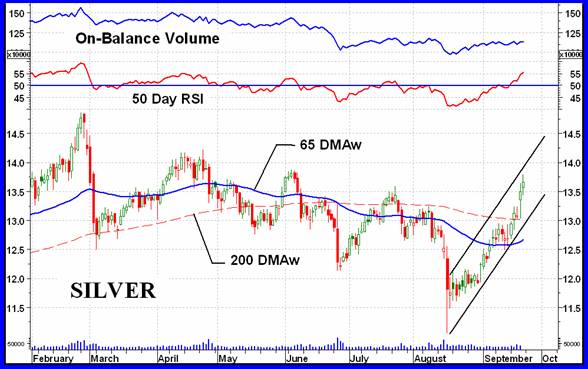
What we have here in the chart is a sharp rally in price with confirmation by the momentum indicator. This is one of the few precious metal charts where the momentum indicator is in fact slightly ahead of the price action, as it should be. Volume action is, however, a little weak and could use some pepping up. Silver is rated as POS for all three time periods in the table. The charts and indicators confirm such ratings.
MERV'S QUAL-SILVER INDEX : MERV'S SPEC-SILVER INDEX
With silver advancing by 7.7% and gold only by 3.2% it is only logical that the silver Indices would do better than the gold (more appropriately, precious metals) Indices. And with the rush going into the quality stocks the Qual-Silver Index did the best with a gain of 9.3% on the week. The Spec-Silver came in at a gain of 7.2%. With only 10 component stocks in the Index the Qual-Silver had a 100% performance on the up side while the Spec-Silver had a lower 76% (19 winners) upside performance. All time periods of the Qual-Silver Index had BULL ratings for the summation of individual ratings category while the Spec-Silver had a BULL rating only for the short term.
The intermediate term was at a NEUTRAL rating and the long term was still BEARISH. As for the charts and indicators, for the Qual-Silver they are all in the positive while for the Spec-Silver they are struggling. I would call the intermediate term for the Spec-Silver as BULLISH but only very slightly so at this time. The long term for the Spec-Silver is a little harder. Momentum has just inched into the positive but the moving average is still negative. I would be inclined to go with a – NEUTRAL rating which is one step above a full bearish rating.
Merv's Precious Metals Indices Table
Well, that's it for this week.
By Merv Burak, CMT
Hudson Aero/Systems Inc.
Technical Information Group
for Merv's Precious Metals Central
Web: www.themarkettraders.com
e-mail: merv@themarkettraders.com
During the day Merv practices his engineering profession as a Consulting Aerospace Engineer. Once the sun goes down and night descends upon the earth Merv dons his other hat as a Chartered Market Technician ( CMT ) and tries to decipher what's going on in the securities markets. As an underground surveyor in the gold mines of Canada 's Northwest Territories in his youth, Merv has a soft spot for the gold industry and has developed several Gold Indices reflecting different aspects of the industry. As a basically lazy individual Merv's driving focus is to KEEP IT SIMPLE .
To find out more about Merv's various Gold Indices and component stocks, please visit www.themarkettraders.com and click on Merv's Precious Metals Central . There you will find samples of the Indices and their component stocks plus other publications of interest to gold investors. While at the themarkettraders.com web site please take the time to check out the Energy Central site and the various Merv's Energy Tables for the most comprehensive survey of energy stocks on the internet. Before you invest, Always check your market timing with a Qualified Professional Market Technician
Merv Burak Archive |
© 2005-2022 http://www.MarketOracle.co.uk - The Market Oracle is a FREE Daily Financial Markets Analysis & Forecasting online publication.