


I Renounce Monetarism, That Money Supply is a Leading Indicator for Aggregate Demand
Economics / Money Supply Sep 02, 2010 - 01:53 AM GMTBy: Paul_L_Kasriel

 Monetarism, the notion that the behavior of some definition of the money supply is a leading indicator of aggregate demand, is akin to malaria. Once it is in your "system," it is very difficult to totally purge it from your system. Early in my career, I was strongly sympathetic toward monetarism. In the late 1990s, I was introduced to the Austrian school of economics, in particular, the Austrian theory of the business cycle (ATBC). I was immediately sympathetic to the ATBC because bank credit played such an important role in it.
I and the Austrians believe bank credit is unique inasmuch as an increase in it unambiguously implies an increase in nominal aggregate demand for goods, services and/or assets. That is, an increase in the banking system's earning assets allows the recipients of this bank credit to increase their purchases of goods, services and/or assets without necessitating a corresponding decline in current spending by any other entity.
The ATBC is not necessarily at odds with monetarism so long as the money supply, however defined, moves in tandem with bank credit. A priori, we would expect this to be the case inasmuch as bank deposits are an important component of any definition of the money supply and bank deposits are liabilities of the banking system. If bank credit increases, that is, assets of the banking system increase, we know from Accounting 101 that the sum of bank liabilities and bank net worth also must increase. Again, given that bank deposits are a subset of bank liabilities, it stands to reason that bank deposits would increase as bank credit increases.
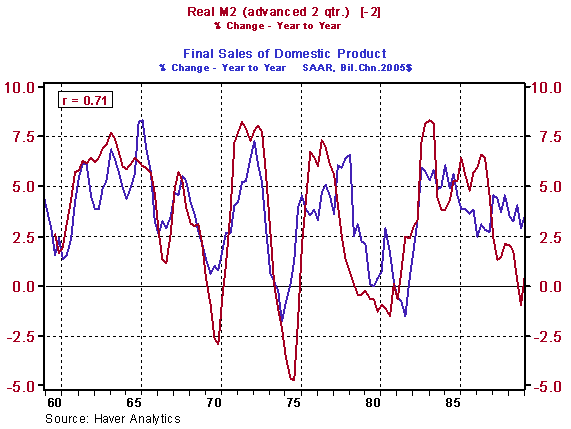
The dean of monetarism, Milton Friedman, seemed to have a preference for the M2 definition of the money supply because of empirical reasons - it "worked" the best in predicting aggregate demand. And, indeed from 1960 through 1989, the price-adjusted M2 money supply, had a relatively high correlation with real aggregate demand for goods and services. This is shown in Chart 1. The definition of real aggregate demand I have chosen is real final sales of domestic product. This is real GDP excluding the change in business inventories. Nominal M2 is deflated by the chain-price index for final sales to domestic purchasers. The year-over-year percent change in both series is plotted in Chart 1. The highest correlation between the two is obtained when real M2 leads, or is advanced, by two quarters. This correlation is 0.71 out of a possible 1.00. No reason to abandon monetarism on this count.
Chart 1
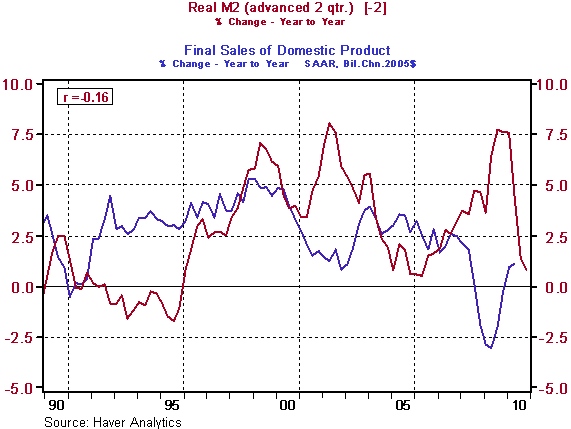
But wait. From 1990 through the second quarter of 2010, the correlation between real M2 and real final sales of domestic product deteriorated dramatically. For starters, the correlation between changes in real M2 and changes in real final sales of domestic product is negative. This is certainly not consistent with monetarism. The only way a positive correlation can be obtained between these two series during this time period is with changes in aggregate demand leading changes in real M2 - not exactly what Milton Friedman had in mind.
Chart 2
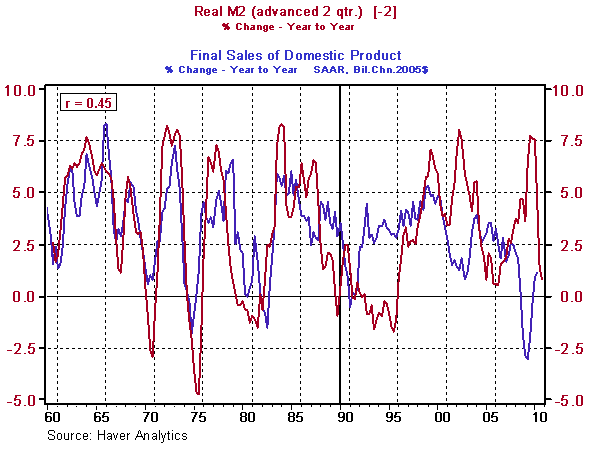
For the record, over the entire 1960 through 2010 period, the highest correlation between year-over-year percentage changes in real M2 and real final sales of domestic product at 0.45 is obtained with real M2 leading by two quarters. But it is readily observable in Chart 3 that after 1989, there is a negative relationship between the two series rather than a positive one hypothesized by monetarism.
Chart 3
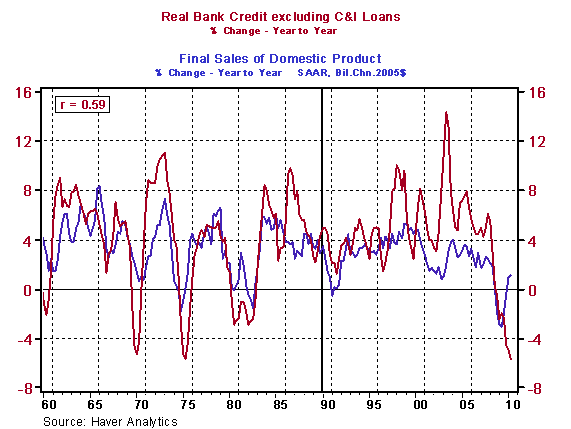
Now let's take a look at the correlation between percentage changes in real bank credit and percentage changes in real final sales of domestic product. I exclude C&I loans from bank credit inasmuch as these loans are a lagging indicator of economic activity rather than a leading indicator. Chart 4 shows the relationship between the two series over the entire 1960 - 2010 period. The highest positive correlation, 0.59, is obtained when the two series are coincident to each other. Although the magnitude of the correlation coefficient decreases when the percentage change in real bank credit is advanced or the percentage change in real final sales of domestic product is advanced, the magnitude falls more when the percentage change in real final sales is advanced. This is prima facie evidence that the percentage change in real final sales does not lead the percentage change in real bank credit. Over this entire period of 1960 - 2010, the magnitude of the correlation between the percentage changes in real final sales is higher against real bank credit (-0.59) than it is against real M2 (0.45).
Chart 4
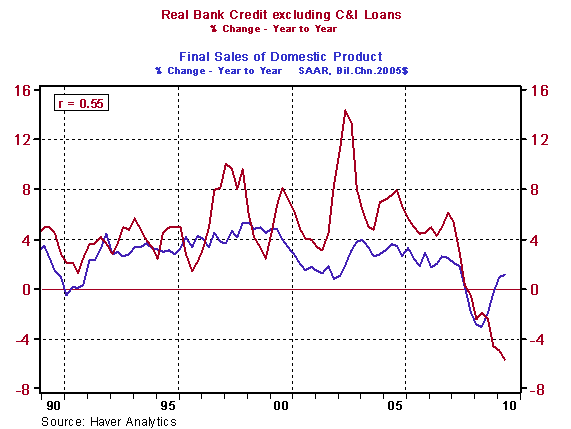
Now let's look at the relationship between the percentage change in real bank credit and the percentage change in real final sales of domestic product in the two sub-periods. These relationships are shown in Charts 5 and 6. In the first sub-period, 1960 - 1989, the correlation between percentage changes in real bank credit and real final sales is 0.66, marginally lower than the 0.71 correlation between percentage changes in real M2 and real final sales. Although in the second sub-period, 1990 - 2010, the correlation between percentage changes in real bank credit and real final sales decreases to 0.55, the sign on the correlation is "correct" and a 0.55 correlation is nothing to sneeze at. Recall that in the second sub-period, the sign on the correlation between percentage changes in real M2 and real final sales was "wrong."
Chart 5
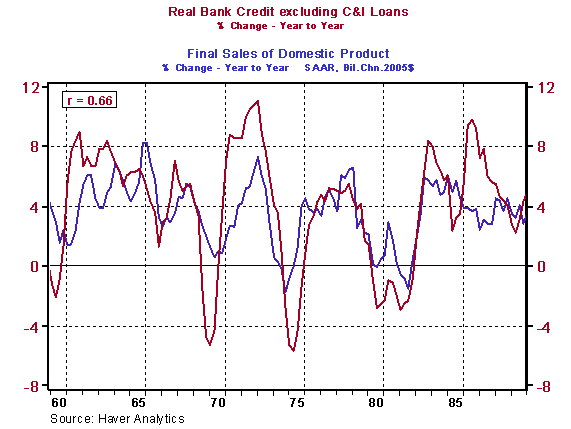
Chart 6
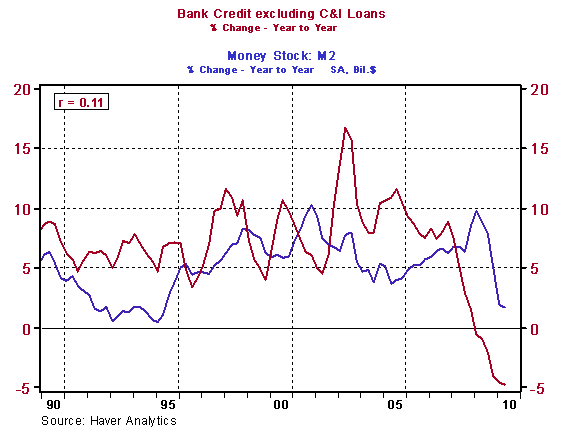
Why might have M2 "failed" in the second sub-period whereas bank credit held its own? In an attempt to answer this question, let's look at the relationships between percentage changes in bank credit excluding C&I loans and M2 in both of the sub-periods as shown in Charts 7 and 8. Changes in bank credit and M2 have a relatively high correlation, 0.55, in the sub-period 1960 - 1989. That correlation drops off dramatically to 0.11 in the second sub-period, 1990 - 2010. These findings suggest that some of the "success" that M2 had in "explaining" aggregate demand in the first sub-period might really have been due to M2 "masquerading" as bank credit, given the relatively high correlation between the two in that first sub-period.
Chart 7
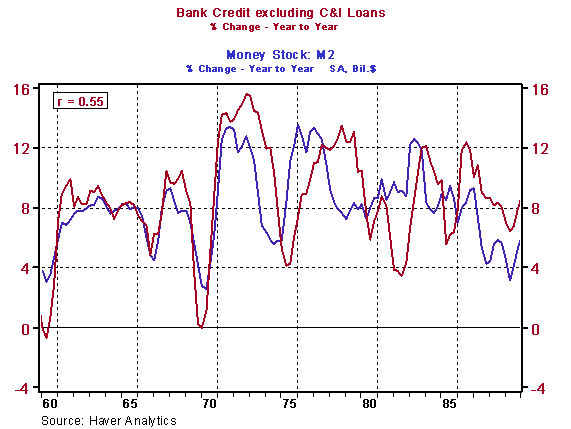
Chart 8
In conclusion, to paraphrase the Seinfeld character, Mr. Lippman, I renounce monetarism. Instead, I now embrace bank creditism. Just as George Costanza embraced the Latvian Orthodox faith ostensibly because he liked the "hats" the priests wore, I embrace bank creditism because I like the correlations it has with aggregate demand.
by Paul Kasriel
Paul Kasriel is the recipient of the 2006 Lawrence R. Klein Award for Blue Chip Forecasting Accuracy
by Paul Kasriel
The Northern Trust Company
Economic Research Department - Daily Global Commentary
Copyright © 2010 Paul Kasriel
Paul joined the economic research unit of The Northern Trust Company in 1986 as Vice President and Economist, being named Senior Vice President and Director of Economic Research in 2000. His economic and interest rate forecasts are used both internally and by clients. The accuracy of the Economic Research Department's forecasts has consistently been highly-ranked in the Blue Chip survey of about 50 forecasters over the years. To that point, Paul received the prestigious 2006 Lawrence R. Klein Award for having the most accurate economic forecast among the Blue Chip survey participants for the years 2002 through 2005.
The opinions expressed herein are those of the author and do not necessarily represent the views of The Northern Trust Company. The Northern Trust Company does not warrant the accuracy or completeness of information contained herein, such information is subject to change and is not intended to influence your investment decisions.
Paul L. Kasriel Archive |
© 2005-2022 http://www.MarketOracle.co.uk - The Market Oracle is a FREE Daily Financial Markets Analysis & Forecasting online publication.