


Stock Market Returns After Interest Rate Cuts
Stock-Markets / US Interest Rates Sep 25, 2007 - 12:06 AM GMTBy: Hans_Wagner

 On September 18, 2007 the U.S. Federal Reserve lowered the Federal Funds rate and the Discount rate by 0.50% and the stock market leapt up by 2.9% for the day. Many investors were surprised by the Fed's move and wished they had been fully invested in the market. So, will the market continue up as a result of the move by the Fed? It turns out that there are a couple of studies that we might use to give us some guidance.
“Two Tumbles and a Jump”
An indicator developed by Norman Fosback of the Institute of Econometric Research gives us a good idea of the direction the stock market will take when the Fed lowers a key rate. In Fosback's book Stock Market Logic: A Sophisticated Approach to Profits on Wall Street (Dearborn Financial Publishing) ![]() he states when the discount rate, the banking reserve requirement, or the margin requirement are lowered twice after an increase, the market usually makes big gains.
he states when the discount rate, the banking reserve requirement, or the margin requirement are lowered twice after an increase, the market usually makes big gains.
It turns out that when the Fed lowers one of their key rates they manage twice in a row after raising rates, the stock market will be up in the following months and year. Fosback, who worked for the Institute of Econometric Research, reports that twenty calendar days after the signal, the S&P 500 is usually up an average of 4%, after three months 11%; after six months, 15.9%, and after one year, 29.7%.
According to Professor Jeremy Siegel at the University of Pennsylvania, Wharton School of Finance, when the Fed lowers the Federal Funds rate, it is very bullish for the stock market. In Siegel's book Stocks for the Long Run: The Definitive Guide to Financial Market Returns and Long-Term Investment Strategies , he presents a table illustrating how changes in the Fed Funds rates since 1955 have effectively predicted future stock prices. According to Siegel, in the 12 months following Fed Fund rate increases the market as measured by the S&P 500, has been about 7 percent higher. However, in the 12 months following a Fed Funds rate cut, the S&P 500 has been 18 percent higher.
This looks like an excellent indicator to follow. Let's look at the history in a little more detail to see what it says.
History Shows Indicator is Right, Mostly
The “Two Tumbles and a Jump” rules states that when the Federal Reserve eases monetary policy by decreasing one of the three basic policy variables (Discount rate, Margin Requirement, or Reserve Requirement) two times in succession, conditions are favorable for an ensuing jump in stock prices. Since the Federal Reserve was formed in 1913, there have been only 22 signals from the Two Tumbles and a Jump Rule (as of 2007).
The table below presents the case that the “Two tumbles and a Jump” works with one exception.
| Signal No. | Date of Signal (second time rate was lowered) | S&P 500 Index Max % Gain Within One Year | S&P 500 Index Maximum % Loss within One Year |
1 |
Dec 23, 1914 |
+ 82% |
0% |
2 |
June 16, 1921 |
+ 41% |
- 6% |
3 |
June 12, 1924 |
+ 42% |
0% |
4 |
Nov 15, 1929 |
+ 28% |
- 23% |
5 |
June 24, 1932 |
+ 137% |
- 4% |
6 |
May 26, 1933 |
+ 31% |
- 8% |
7 |
Sep 14, 1942 |
+ 48% |
0% |
8 |
Mar 30, 1949 |
+ 16% |
-11% |
9 |
Apr 16, 1954 |
+ 36% |
- 1% |
10 |
Jan 24, 1958 |
+ 34% |
- 3% |
11 |
Aug 12, 1960 |
+ 20% |
- 7% |
12 |
July 10, 1962 |
+ 24% |
- 6% |
13 |
Dec 4, 1970 |
+ 17% |
0% |
14 |
Dec 6, 1971 |
+ 22% |
0% |
15 |
Jan 9, 1975 |
+ 34% |
- 1% |
16 |
June 12, 1980 |
+ 22% |
- 1% |
17 |
Dec 3, 1981 |
+ 31% |
- 3% |
18 |
Nov 22, 1983 |
+ 96% |
- 11% |
19 |
Oct 29, 1989 |
+ 39% |
- 16% |
20 |
Dec 19, 1995 |
+ 150% |
- 2% |
21 |
Jan 31, 2001 |
0% |
-39% |
22 |
Sep 18, 2007 |
||
37% median |
- 7% median |
First of all notice that while the market as measured by the S&P 500 was up 21 out of 22 times, it also spent some time on the down side during for 17 of those times. Second, with a median average of 37%, this rule provides investors with substantial confidence that the market will be higher one year from the date of the second rate decrease. So how do we know the latest rate decrease is the real thing?
Will it Work This Time?
This rule seems to work well when the market is reasonably valued and deflation is not a concern. In the only time the rule failed was during the 2000 – 2002 bear market when many analysts who followed this rule believed the market would go up. In this case the Fed cut rates more than a dozen times even as the market continued to plunge.
What they failed to see was why the indicator worked in the past. In the January 31, 2001 case analysts failed to recognize that valuations were extremely high and that there were growing fears that deflation would be come a problem.
The proper approach is to assess the current situation to see what other problems exist in the economy that would cause stock prices to fall rather than rise. These include high historical valuations, fear of deflation, extreme credit risks, etc. Investors should make a reasonable assessment regarding the fundamental reasons for the lower rates and if the economy is in major trouble or just undergoing a more normal slow down or short term down cycle. Those that follow an indicator blindly will suffer the consequences.
What This Means for Us
It is clear that the Two Tumbles has taken place as the Federal Reserve has lowered the Discount Rate twice, first on August 17, 2007 then again on September 18, 2007. Before we come to the conclusion that the market will be higher are there any fundamental factors that might cause the market to fall rather than rise?
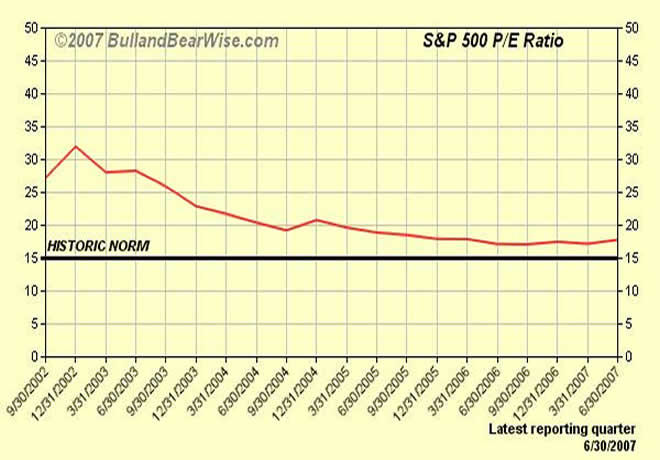
First, stocks are not over valued as the P/E ratio is very close to its historical norm and well below the highs of 2002. So valuations are close to normal, though it is certainly possible that the P/E ratio could fall further over time.
Second, we are experiencing inflation just over 2%, and there are some concerns that we will see higher inflation in the future due to higher oil and commodities. So deflation does not look like a problem.
Third, the U.S. economy is experiencing credit problems due to the unusually lax loan qualification requirements on the part of lenders. This credit crunch is causing problems for the sub-prime mortgage markets and credit facilities available to many private equity firms to facilitate their business. Will this problem cause the stock market to fall rather than rise? It has caused problems for companies that are directly affected by the credit problems. However, rates are following a more normal yield curve indicating that the credit markets have some confidence that the current credit problems are manageable.
Fourth, falling dollar will work to help offset the United States balance of payments as it makes goods and services sold from the U.S less expensive and increases the cost of goods and services purchased from other countries. This should be positive for the companies that export, though it is likely to increase the cost of goods that are imported, especially those from countries that do not peg their currency to the dollar. It may also cause slightly higher inflation as the cost of energy and high cost import goods are absorbed into the U.S. economy.
Also, currently, oil is priced in U.S. dollars. As the dollar losses value it tends to drive up the price of oil. This may force oil exporting countries to change to another currency or go to a basket of currencies. If this happens then the price of energy in the U.S. will continue to remain high and contribute to an economic slowdown in the short term. Longer term it will encourage the transition to more energy efficient uses of oil and the transition to alternative sources.
The Bottom Line
For now the U.S. is likely to experience a slightly better economy due to the lower Federal Funds and Discount rates. While the fully impact of a rate decrease takes six or more months to take affect, it should encourage the stock market to be more positive as it is considered forward looking, at least most of the time. Whether we will see further rate cuts is another matter, depending greatly on how the economy performs over the next few weeks and months. In any case we are learning that Ben Bernanke is willing to make bold moves to support the economy when necessary. Based on our limited experience this is a positive for the markets and the economy. Now if inflation will just stay under control.
By Hans Wagner
tradingonlinemarkets.com
My Name is Hans Wagner and as a long time investor, I was fortunate to retire at 55. I believe you can employ simple investment principles to find and evaluate companies before committing one's hard earned money. Recently, after my children and their friends graduated from college, I found my self helping them to learn about the stock market and investing in stocks. As a result I created a website that provides a growing set of information on many investing topics along with sample portfolios that consistently beat the market at http://www.tradingonlinemarkets.com/
Hans Wagner Archive |
© 2005-2022 http://www.MarketOracle.co.uk - The Market Oracle is a FREE Daily Financial Markets Analysis & Forecasting online publication.