


Stock Market QE2 and Elections Uncertainty Rules...
Stock-Markets / Stock Markets 2010 Nov 01, 2010 - 07:31 AM GMTBy: Mark_McMillan

 GDP met expectations but that wasn't enough as investors fret over elections and QE2 concerns...
Recommendation: Take no action.
Daily Trend Indications:
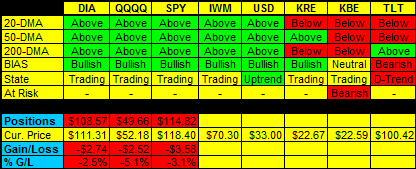
- Positions indicated as Green are Long positions and those indicated as Red are short positions.
- The State of the Market is used to determine how you should trade. A trending market can ignore support and resistance levels and maintain its direction longer than most traders think it will.
- The BIAS is used to determine how aggressive or defensive you should be with a position. If the BIAS is Bullish but the market is in a Trading state, you might enter a short trade to take advantage of a reversal off of resistance. The BIAS tells you to exit that trade on "weaker" signals than you might otherwise trade on as the market is predisposed to move in the direction of BIAS.
- At Risk is generally neutral represented by "-". When it is "Bullish" or "Bearish" it warns of a potential change in the BIAS.
- The Moving Averages are noted as they are important signposts used by the Chartists community in determining the relative health of the markets.
Current ETF positions are:
Short DIA at $108.57
Short QQQQ at $49.66
Short SPY at $114.82
Daily Trading Action
The major index ETFs opened lower and traded higher in a choppy fashion for the first hour then traded lower into noon. From there, it was a mixed bag as the Dow and S&P-500 were able to rally and achieved positive closes while the NASDAQ-100 also rallied somewhat but was unable to sustain the gains and closed modestly lower. The Russell-2000 (IWM 70.30 +0.22) posted a fractional gain and the Semiconductor Index (SOX 372.64 +2.30) also posted a gain and has moved into an uptrend state. The bank indexes closed nearly flat with the Bank Index (KBE 22.59 -0.02) edging lower while the Regional Bank Index (KRE 22.67 +0.01) edged higher. The 20+ Yr Bonds (TLT 100.42 +0.93) added most of one percent as they added to Thursday's gains. NYSE volume was light with 982M shares traded. NASDAQ volume was average with 2.048B shares traded.
There were four economic reports of interest released:
- Advanced GDP (Q3) came in at +2.0% as expected
- Advanced GDP Price Index (Q3) rose +2.3% versus an expected +1.9%
- UofMichigan Consumer Sentiment (Oct) came in at 67.7 versus an expected 68.5
In addition, the Chicago PMI report came out near expectations so was not a factor.
The U.S. dollar dropped 0.2% which helped the Dow and S&P-500 to finish in positive territory.
Five out of ten economic sectors in the S&P-500 moved higher led by Materials (+0.9%). HealthCare (-0.5%), Financials (-0.2%), Consumer Discretionary (-0.1%), Tech (-0.1%), and Energy (-0.1%) moved lower.
Implied volatility for the S&P-500 (VIX 21.20 +0.32) crept up most of one and one half percent and the implied volatility for the NASDAQ-100 (VXN 22.24 +0.59) moved up most of three percent.
The yield for the 10-year note fell five basis points to close at 2.61. The price of the near term futures contract for a barrel of crude oil fell seventy-five cents to close at $81.43.
Market internals were positive with advancers leading decliners 3:2 on the NYSE and by 5:4 on the NASDAQ. Up volume led down volume by under 5:4 on the NYSE and by just over 5:4 on the NASDAQ. The index put/call ratio rose 0.12 to close at 1.54. The equity put/call ratio fell 0.06 to close at 0.56.
Commentary:
Friday's trading action reflected disappointing economic reports but an overall bullish belief that QE2 is a done deal. The uncertainty is what will happen in the mid-term elections held on Tuesday and how extensive will the next round of quantitative easing be? The Fed Open Market Committee (FOMC) meets and releases its policy statement on Wednesday afternoon. The commonly held belief is that the Democrats will lost control of the house and that Republicans will come close to taking half the seats in the Senate. This landslide isn't so much a vote for Republicans as a vote against the Democrats as the incumbents during the financial crisis and te party the passed the wildly unpopular Healthcare bill.
The dollar continues in its range. A drop in the dollar below its current range would likely spur a rally in equities while a move higher that broke out of the range could sink them if the inverse correlation continues to hold. Bonds continued to move higher rising nearly 1% in value on Friday. QE2 is expected to be for $100B in long-term bond prices monthly so this could support a further rise in bond prices. If bond prices move lower, that would signal that bond investors are more worried about inflation than comfortable with the Fed purchases on U.S. government long term debt.
We hope you have enjoyed this edition of the McMillan portfolio. You may send comments to mark@stockbarometer.com.
If you are receiving these alerts on a free trial, you have access to all of our previous articles and recommendations by clicking here. If you do not recall your username and/or password, please email us at customersupport@stockbarometer.com.
By Mark McMillan
Important Disclosure
Futures, Options, Mutual Fund, ETF and Equity trading have large potential rewards, but also large potential risk. You must be aware of the risks and be willing to accept them in order to invest in these markets. Don't trade with money you can't afford to lose. This is neither a solicitation nor an offer to buy/sell Futures, Options, Mutual Funds or Equities. No representation is being made that any account will or is likely to achieve profits or losses similar to those discussed on this Web site. The past performance of any trading system or methodology is not necessarily indicative of future results.
Performance results are hypothetical. Hypothetical or simulated performance results have certain inherent limitations. Unlike an actual performance record, simulated results do not represent actual trading. Also, since the trades have not actually been executed, the results may have under- or over-compensated for the impact, if any, of certain market factors, such as a lack of liquidity. Simulated trading programs in general are also subject to the fact that they are designed with the benefit of hindsight. No representation is being made that any account will or is likely to achieve profits or losses similar to those shown.
Investment Research Group and all individuals affiliated with Investment Research Group assume no responsibilities for your trading and investment results.
Investment Research Group (IRG), as a publisher of a financial newsletter of general and regular circulation, cannot tender individual investment advice. Only a registered broker or investment adviser may advise you individually on the suitability and performance of your portfolio or specific investments.
In making any investment decision, you will rely solely on your own review and examination of the fact and records relating to such investments. Past performance of our recommendations is not an indication of future performance. The publisher shall have no liability of whatever nature in respect of any claims, damages, loss, or expense arising out of or in connection with the reliance by you on the contents of our Web site, any promotion, published material, alert, or update.
For a complete understanding of the risks associated with trading, see our Risk Disclosure.
© 2010 Copyright Mark McMillan - All Rights Reserved
Disclaimer: The above is a matter of opinion provided for general information purposes only and is not intended as investment advice. Information and analysis above are derived from sources and utilising methods believed to be reliable, but we cannot accept responsibility for any losses you may incur as a result of this analysis. Individuals should consult with their personal financial advisors.
© 2005-2022 http://www.MarketOracle.co.uk - The Market Oracle is a FREE Daily Financial Markets Analysis & Forecasting online publication.