


Stock Market Update: Niagara in a Barrel
Stock-Markets / US Stock Markets Oct 14, 2007 - 08:48 PM GMTBy: Dominick
 By now, those of you who read this update regularly but aren't members must think what we say about what we do at TTC is just too good to be true. That we're just lucky bulls. I mean, week after week the market bucks some of the best traders and analysts out there, yet I continue to claim unbiased Elliott wave analysis produces consistently profitable trades and avoids all the traps. Go figure.
Well, if you're in this category, you'll be happy to know that this week played out so perfectly to the downside that even members who witnessed the entire thing, and are used to having the market verify our outlook by now, had to rub their eyes and check the screen again! This isn't bragging because, to be honest, the market got stretched to the limit and so did a lot people's patience. But our targets hit exactly to the tick two days in a row, and that kind of confirmation is hard to ignore. New members who joined this week sure picked a fine time to learn the discipline of unbiased trading. Reader, you may have your doubts, but you better believe the new money in members' accounts is real!
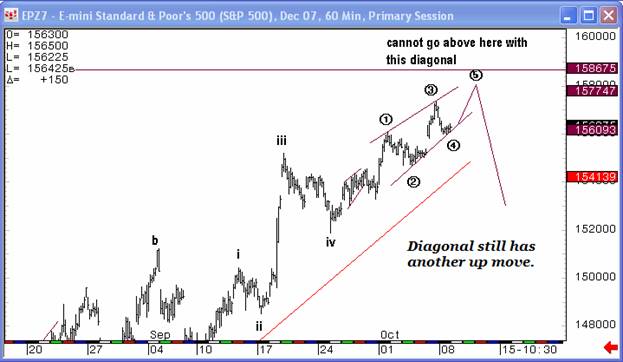
You'll remember last week I said I wasn't calling a top, but was looking for something to possibly get started on the downside, though I admitted there could be some wiggles to the upside. The idea behind that was an ending diagonal we'd been monitoring which, of course, would naturally lead to a fairly serious decline. Monday morning brought some selling pressure, but when the S&P found support at a trendline off the August lows, it was time to sell the puts. The chart below was posted with the conclusion that the diagonal still had further to go and an upper limit for the advance. This wrinkle wasn't terribly surprising though, since an ending diagonal is supposed to chop its way higher and keep traders out as the market attempts to take the most money from the greatest number of people. It was, however, exactly the sort of realtime “rolling analysis” we described last week as our specialty, and why we don't put everything into these weekend editions.
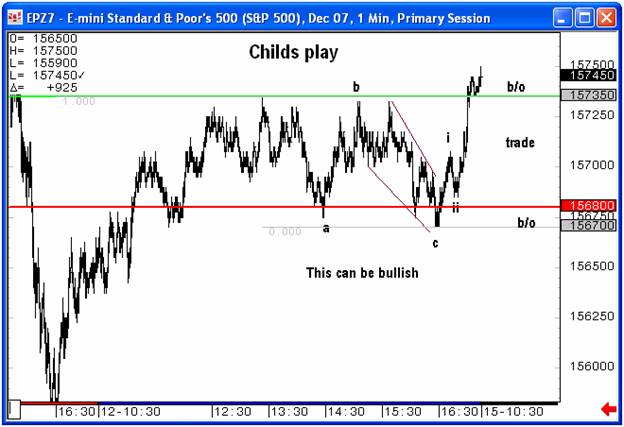
So the market rallied, and, for a while there, it looked like Tuesday night's high could have been the top of the pattern. But the selloff Wednesday morning was sluggish and lacked the conviction of the sort of waterfall you would expect after an ending diagonal pattern. We mentioned last week the marriage of Elliott wave analysis and our own proprietary target levels, and here was another perfect example. When the futures bounced off our possible support level of 1566 it was clear we were not yet seeing the sort of selling we'd been hinting at last week. So lightening up on the puts was the only move.
Sure enough, the market reversed off 66 and rallied strongly through the close Wednesday and most of Thursday. It was, in fact, the sort of rally that had CNBC flashing record highs on their screens with big grins on the faces of the anchors. All week, in fact, tech stocks like GOOG, RIMM, AAPL and BIDU extended to all-time highs and it was hard to find a patiently bearish trader anywhere. Except at TTC.
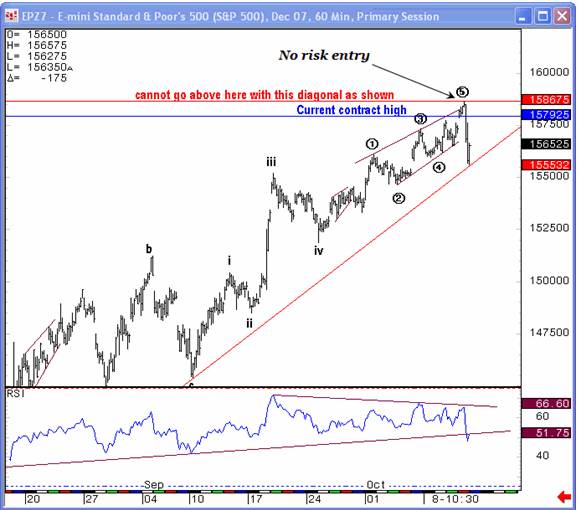
It looked to most like there was nothing overhead but S&P 1600 and beyond, but we had a magic number and would not get bullish in a choppy market until we'd taken it out. As I mentioned before, we saw the ending diagonal and had 1586.75 as the upper limit. Cross that line and we'd have to scrap the chart and find something else. But not before. Unfortunately for most, however, the strength of the rally signaled plenty of short covering.
And then it happened. The S&P futures hit our 1586.75 target exactly to tick, but for members at TTC, this was not time for capitulation, it was a chance for a zero-risk short entry! The futures traded lower from our target and then lower still. In the two hours that followed, the S&P would give up almost 30 points in a cascading waterfall selloff that had put buyers feeling like they'd gone over Niagara in a barrel – in a good way! As the television anchors scrambled to cobble together some explanation for the dramatic reversal that seemed to appear out of nowhere, there was a group of traders online learning once again that unbiased Elliott wave works.
Now, most advisory sites on the web go to great lengths to nurture the bearish tendencies of retail traders. They'll sell you on the absurdity of government statistics, on the inevitably of a financial collapse. But they'll also have you short bottoms, and hold puts as the markets bounce off support. An unbiased trader knows there'll be good shorts, but waits until it's time!
But, anyone who was talked into the crash scenario on Monday or Wednesday's selloffs, was at a serious disadvantage on Thursday, even as we went over the falls. IF they didn't capitulate first, as so many obviously did, they were only making back losses instead of seeing real profits. Most, however, probably sold into the highs and then, just as the selling started, had to wait before shorting again, since they'd just covered.
Of course even the greatest of waterfalls have bottoms and we expected nothing less than that for the bottom of this selloff to appear at one of our support levels. As it turned out, 1567.50 held, and this is a number regular readers might find if they searched through the archives, but which TTC members had been trading against for weeks. Meanwhile, traders who hesitated, bought crash puts and went into their bunkers found themselves giving back profits into the close Thursday and Friday's open. After all, taking money is what the market is designed to do.
And, while expecting a retest of the lows might have seemed like the obvious move for Friday, TTC was expecting an inside day that searched out concrete support and resistance. The daily post for Friday even said, “Bulls right now think they can see new highs tomorrow, bears will think 1300 is next. I think tomorrow becomes an exploration day to see where some support and resistance will show up. I think the day may not go far from a range.”
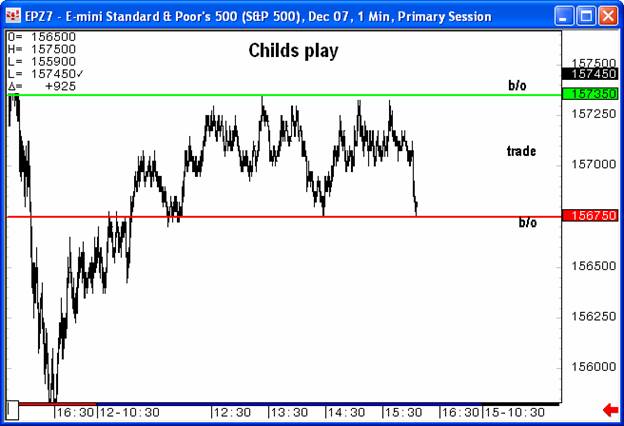
The range we favored was the 67.50 low from Thursday's selloff and 1573.50, which was a level we had previously considered as a possible top for the ending diagonal. The chart I posted at the end of the day Friday, shown below, probably seems cocky, but what are you supposed to do when you call the exact high for the day two days in a row.
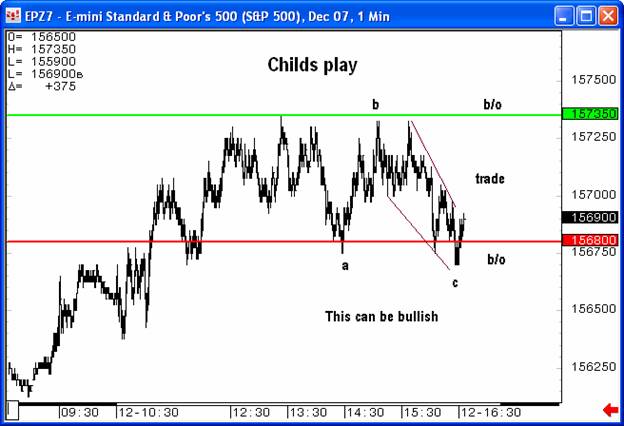
But just as it looked again as the market was going to break to the downside, we squeezed at the last minute, just after we posted the next chart saying the bearish LOOKING setup was about to become bullish.
Sure enough, they did it once again to the struggling bears and had them trapped into the close. Us, we walked away adding a few more points to our P&L into the final minutes of a very busy few days.
In the end, this week's action leaves us a bit wealthier, but in roughly in the same position as last week, where we smelled a top and looked for some development to the downside. Only now, we've gotten resistance at our number. Of course, we know there's still more work to be done and the market won't move in a straight line, but we think we know where it's headed. And, if our plans for this market are correct, which they just happen to have been since the March lows, let me tell you, if you think you saw capitulation this week, you ain't seen nothing yet! But don't go over the falls without a barrel, because this market just might have its best dress saved for a last dance later on this year and you wouldn't want to miss that party!! In the meantime, next week is the '87 crash anniversary, of course, so be sure to check out Vince's article to cut through the doom and gloom, or ludicrous optimism, and just trade the charts. Gold is also getting a lot of attention lately, and Joe has the latest in his Precious Points update.
Don't forget to join for only $89 a month!
Have a profitable and safe week trading, and remember:
“Unbiased Elliott Wave works!”
By Dominick
For real-time analysis, become a member for only $89
If you've enjoyed this article, signup for Market Updates , our monthly newsletter, and, for more immediate analysis and market reaction, view my work and the charts exchanged between our seasoned traders in TradingtheCharts forum . Continued success has inspired expansion of the “open access to non subscribers” forums, and our Market Advisory members and I have agreed to post our work in these forums periodically. Explore services from Wall Street's best, including Jim Curry, Tim Ords, Glen Neely, Richard Rhodes, Andre Gratian, Bob Carver, Eric Hadik, Chartsedge, Elliott today, Stock Barometer, Harry Boxer, Mike Paulenoff and others. Try them all, subscribe to the ones that suit your style, and accelerate your trading profits! These forums are on the top of the homepage at Trading the Charts. Market analysts are always welcome to contribute to the Forum or newsletter. Email me @ Dominick@tradingthecharts.com if you have any interest.
This update is provided as general information and is not an investment recommendation. TTC accepts no liability whatsoever for any losses resulting from action taken based on the contents of its charts, commentaries, or price data. Securities and commodities markets involve inherent risk and not all positions are suitable for each individual. Check with your licensed financial advisor or broker prior to taking any action.
Dominick Archive |
© 2005-2022 http://www.MarketOracle.co.uk - The Market Oracle is a FREE Daily Financial Markets Analysis & Forecasting online publication.