


Stock Market Elliott Wave Trend Analysis Into End of 2010 and 2011 Start
Stock-Markets / Stock Markets 2010 Dec 26, 2010 - 06:48 AM GMTBy: Tony_Caldaro

 It was a productive albeit quiet week of trading in the US. The market made a new bull market high in the opening minutes of trading on monday, made higher highs over the next two days, and closed out the week within two points of the SPX 1259 bull market high. The week’s fourteen economic reports were all jammed into the last two days of trading. Twelve were positive or improving, and only two were flat or lower. The rundown. Weekly jobless claims were flat, and the weekly M1 multiplier declined this week. Q3 GDP was raised to 2.6%, existing/new home sales rose, as did FHFA home prices and weekly mortgage applications. Durable goods orders improved, personal income/spending remained positive, while PCE prices rose, along with, consumer sentiment, the monetary base and the WLEI.
For the week the SPX/DOW were +0.9%, and the NDX/NAZ were +0.7%. Asian markets were -0.1%, European markets were +1.8%, the Commodity equity group was +1.1%, and the DJW index was +1.2%. Bonds were -1.5%, Crude gained 3.6%, Gold added 0.4% and the USD gained up 0.2%. Next week will be a five day trading week despite the saturday New Year holiday. Case-Shiller and the Chicago PMI the main economic reports.
LONG TERM: bull market
As this decade comes to a close we decided not only to review this decade but the last three decades. When the 1980′s began the US markets were nearing the end of the 1967-1982 inflationary secular bear market. President Jimmy Carter was running for re-election and Elliott Wave analysis was just beginning to get noticed. Elizabeth Alexandra Mary had been the Queen of England for 27 years. During her reign she had already met Presidents Eisenhower, Kennedy, Johnson, Nixon, Ford and Carter.
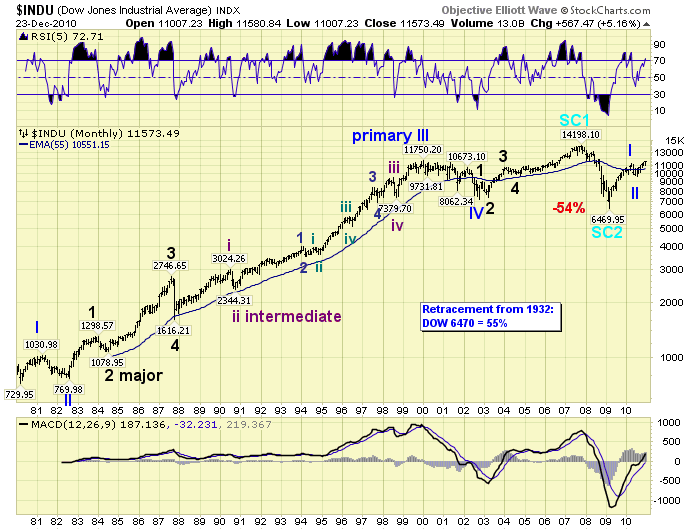
In mid-1982 Reagan was now president, the secular bear market ended with commodities already in a bear market for two years, and supply-side economics was the new buzz word on Wall Street. Cycle wave [4] had bottomed in 1974, Primary wave I of Cycle wave [5] had topped in 1976 and a complex Primary wave II was just bottoming.
Near the end of 1983 the stock market had broken out of its two decade trading range and EW was just beginning to gain traction in technical analysis circles. Major wave 1, of Primary wave III, ended with this 1983 high and Major wave 2 took the market into a mid-1984 low.
During the next three years Major wave 3 unfolded and the market more than doubled. In the early part of this period nearly 100 years of stock market data was now available. The Elliott Wave Theory was studied and then applied to this data in an attempt to verify the theory. By 1985 a modified version of Elliott’s Original Works was discovered, analyzed and implemented. This is when, what we now term, Objective Elliott Wave was originally formulated. Twenty-five years ago.
During 1985 and for most of 1986 the generally accepted Elliott Wave count was confirmed by OEW. Then in the latter part of 1986 and into 1987 the two counts started to seriously diverge. By the spring of 1987 OEW was indicating a Major wave 3 top would conclude during the next uptrend, and the potential for a stock market Major wave 4 crash was increasing. In June 1987 our OEW analysis was published in a Barron’s article. The crash of October 1987 confirmed the validity of this quantitative approach to EW, and the OEW maxim: anticipate, monitor and adjust when necessary was created.
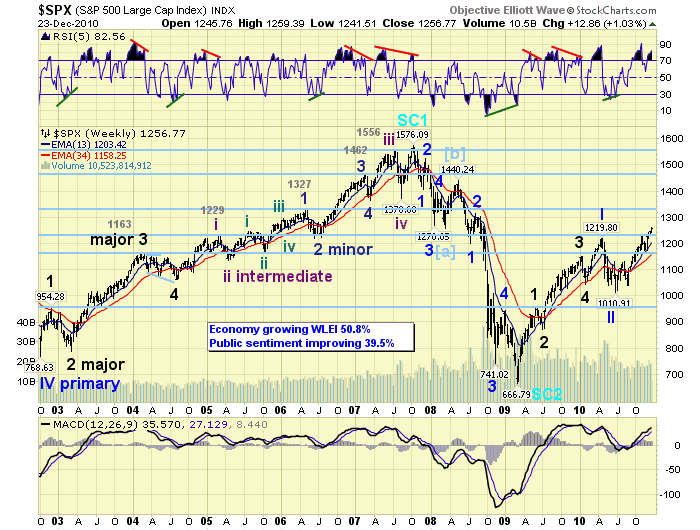
After the 1987 crash the market launched the strongest and longest Major wave 5 in its entire history. Presidents Reagan, Bush Sr. and Clinton headed the US during this period, and Queen Elizabeth met them as well. At the Primary wave III top in 2000 a new secular bear market began. This one, however, was deflationary. In 2001 Commodities started a new bull market. This, historically, is similar to the 1933-1946 commodity bull market during the 1929-1949 deflationary secular bear market.
In October 2002 Primary wave IV bottomed and the market embarked on a five year Primary wave V to conclude Cycle wave [5]. After this October 2007 top the entire five wave Super cycle from 1932-2007 had completed, and the market entered its worse bear market since 1929-1932. Fortunately the 2007-2009 bear market was one of a lesser degree than the larger Grand Super cycle degree top in 1929. Then, the market lost nearly 90% of its value in just 34 months. This Super cycle bear market lasted only 17 months, but did lose nearly 60% of its value in the process.
After the March 2009 low a new Super cycle bull market had begun. This new multi-decade bull market will not display its full thrust until the current Secular bear market ends in the middle of this next decade.
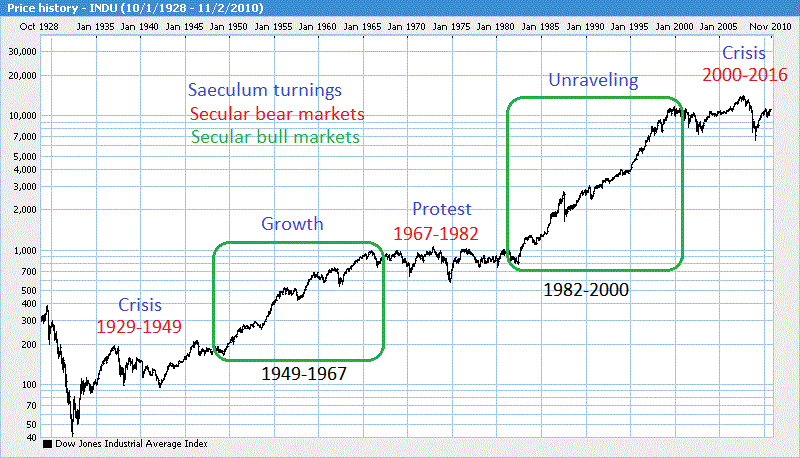
Secular bear markets create stock markets that stay within trading ranges for about 16 years. The 1967-1982 secular bear market kept the DOW in a trading for that entire period. The DOW did make a new high in 1973 completing Cycle wave [3], then a Cycle wave [4] low in 1974. Yet, as described above, the breakout of that trading range did not occur until 1983. Notice a new high was made six years after the secular bear began (1967/1973) and the price low was made eight years before the secular bear ended (1982/1974).
During this secular bear market, estimated to unfold between 2000 and 2016, the price high was made seven years after it began (2000/2007) and the price low seven years before it is estimated to end (2009/2016). A similar symmetry unfolded during the 1929-1949 secular bear market.
While this last decade or so has witnessed booms and busts on a regular basis, only two Presidents have been at the helm: Bush Jr. and Obama. And yes, Queen Elizabeth the Queen of England for nearly 60 years, has met them both.
MEDIUM TERM: uptrend high SPX 1259
The current uptrend, Major wave 1 of Primary wave III, started in the beginning of July. It is getting close to entering its sixth month, which will match the longest uptrend of this bull market: Major wave 3 of Primary I, July 09 to Jan 10. This was projected is our September report: SPX Stocks Bull Market Projection
After a somewhat choppy beginning this uptrend has moved steadily higher from the August low. This uptrend, Major wave 1, is dividing into five Intermediate waves: Int. one SPX 1129, Int. two SPX 1040, Int. three SPX 1227, Int. four SPX 1173 and Int. five underway. Intermediate waves two and four have clear alternation, (zigzag and flat), and this is a modern classic EW bull market pattern. When this uptrend ends, projected to be in January near the OEW 1313 pivot, the market will experience a Major wave 2 correction. After that, a rising Major wave 3 of Primary wave III will get underway taking the market to new bull market highs.
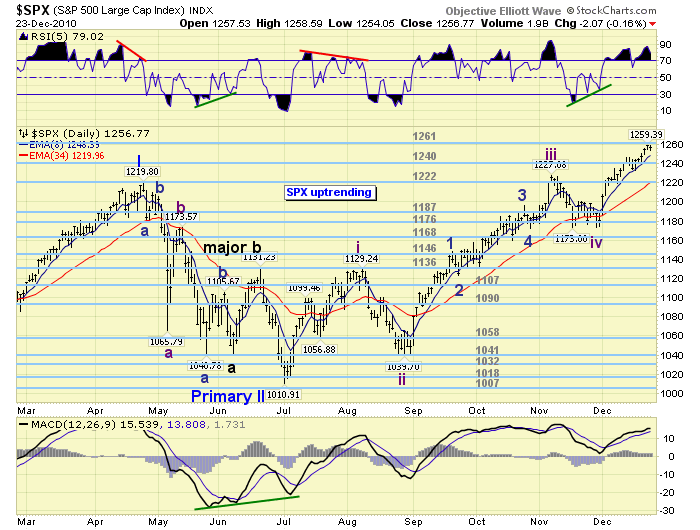
Technicals continue to look good. The weekly chart displays a rising MACD, but a potential negative divergence in the RSI appears to be forming. The daily chart, above, also displays a rising MACD, but the RSI here is making a higher high during Intermediate wave five. This suggests this market is in Minor wave 3 of Int. five, which is the count on our SPX 60min chart. In other areas. The NYAD made new highs this week confirming higher prices ahead longer term. Eight of the nine SPX sectors are in confirmed uptrends and near their highs. The lagging Utility sector is getting close to an uptrend confirmation. Nine of the fifteen world market indices we track are also in uptrends, and three are getting close to confirming uptrends as well. The bull market in equites continues to unfold.
SHORT TERM
Support for the SPX remains at 1240 and then 1222, with resistance at 1261 and then 1291. Short term momentum is rising off a slightly oversold condition on thursday. The short term count, as noted above, suggests Intermediate wave five is currently in Minor wave 3 of a five Minor wave rally from the Int. wave four low. Overhead resistance is currently at the 1261 OEW pivot, then the 1291, 1303 and 1313 pivots after that. Since Int. wave three was longer than Int. wave one, therefore, Int. wave five may be any length and still meet the OEW wave formation guidelines.
Fibonacci analysis suggests there should be little resistance ahead until the OEW 1291 pivot is reached. Around that level we run into a confluence of fibo relationships: @ 1289 Int. five = o.618 Int. three, @ 1291 Int. five = Int. one, @ 1292 Major 1 = Major 3 of Primary I, and @ 1300 Major 1 = Major 1 of Primary I. It appears the OEW 1291 and 1303 pivots will be a tough area to penetrate, and the uptrend will probably end around these levels.
In comparison to other rallies during this bull market Intermediate wave five has been quite steady. After the Int. wave four low in late November, this market has only had two pullbacks of 10 points or more during the entire month of December. As we enter the last trading week of the year, the short term OEW charts remain positive with support around SPX 1252. Before this uptrend ends we should still see Minor waves 3, 4 and 5 of Int. wave five conclude. Best to your trading and week!
FOREIGN MARKETS
Asian markets were mixed on the week for a net loss of 0.1%. Hong Kong’s HSI and China’s SSEC remain in downtrends, while India’s BSE is getting close to confirming an uptrend.
European markets were all higher on the week for a net gain of 1.8%. Both Spain’s IBEX and the STOX 50 are getting close to confirming uptrends.
The Commodity equity group were all higher on the week for a net gain of 1.1%. Only Brazil’s BVSP is in a downtrend.
The DJ World index continues uptrending and gained 1.2% on the week.
COMMODITIES
Bond prices continued their downtrend losing 1.5% on the week. Uptrending Bond yields, however, appear to be setting up a negative divergence uptrend high. Worth watching.
Crude’s uptrend continued to new highs this week at $91.63, gaining 3.6% on the week.
Gold remains in an uptrend but has not made a new high since the beginning of December. Net gain of 0.4% on the week. Its chart pattern remains choppy and it would not take much on the downside to confirm a new downtrend.
The uptrending USD gained 0.2% on the week, while the EUR lost 0.5% and the JPY gained 1.1%. Should the USD index rally over 81.44 this could put downside pressure on the stock market.
NEXT WEEK
Month end, quarter end, and year end results all occur on friday. Economic reports start flowing on tuesday with Case-Shiller housing prices and the Consumer confidence reading. Thursday wraps up the economic week with weekly Jobless claims, the Chicago PMI and Pending home sales. The FED continues their well deserved hiatus. Best wishes to everyone this holiday weekend!
CHART: http://stockcharts.com/def/servlet
CHARTS: http://stockcharts.com/def/servlet/Favorites.CServlet?obj=ID1606987
http://caldaroew.spaces.live.com
After about 40 years of investing in the markets one learns that the markets are constantly changing, not only in price, but in what drives the markets. In the 1960s, the Nifty Fifty were the leaders of the stock market. In the 1970s, stock selection using Technical Analysis was important, as the market stayed with a trading range for the entire decade. In the 1980s, the market finally broke out of it doldrums, as the DOW broke through 1100 in 1982, and launched the greatest bull market on record.
Sharing is an important aspect of a life. Over 100 people have joined our group, from all walks of life, covering twenty three countries across the globe. It's been the most fun I have ever had in the market. Sharing uncommon knowledge, with investors. In hope of aiding them in finding their financial independence.
Copyright © 2010 Tony Caldaro - All Rights Reserved Disclaimer: The above is a matter of opinion provided for general information purposes only and is not intended as investment advice. Information and analysis above are derived from sources and utilising methods believed to be reliable, but we cannot accept responsibility for any losses you may incur as a result of this analysis. Individuals should consult with their personal financial advisors.
© 2005-2022 http://www.MarketOracle.co.uk - The Market Oracle is a FREE Daily Financial Markets Analysis & Forecasting online publication.