


Stock Market Elliott Wave Analysis and Forecast for Week Starting 3rd Jan
Stock-Markets / Stock Markets 2011 Jan 03, 2011 - 01:40 AM GMTBy: Tony_Caldaro

 The US markets spend the holiday week essentially going sideways on light volume. Economic reports were mixed. Case-Shiller housing, consumer confidence and the monetary base all declined. The Chicago PMI, pending homes sales, the WLEI, and the weekly jobless improved, with unemployment claims dropping under 400K for the first time in two years. For the week the SPX/DOW were +0.05%, and the NDX/NAZ were -0.55%. Bonds gained 0.7%, Crude slipped 0.1%, Gold rose 3.0%, and the USD lost 1.8%. Asian markets were mixed gaining 0.2%, European markets were down 2.2%, the Commodity equity group rose 0.6%, and the DJ World index rose 0.8%. Next week will likely be a busy one as most return from holiday. ISM, FOMC minutes and the Payrolls report highlight the week. Best to your New Year!
LONG TERM: The March 2009 bull market continues, and US markets are on track to retest their all time highs by early 2012.
This decade started with the beginning of a decade and a half secular bear cycle. Typically this cycle shifts between bear and bull markets as it unfolds in a large trading. The 2000-2002 bear market was only the beginning. This was followed by the 2002-2007 bull market to marginal new highs. Then the 2007-2009 bear market took the SPX/DOW to new lows for the decade. Now, the 2009-2012 bull market should retest the 2007 highs, before giving way to a more moderate bear market to end the cycle around 2015/2016. After that a new, nearly two decade, secular bull market begins. Quite a choppy, and at times treacherous, investment environment. Yet great for commodity investors!
Our current bull market is a bit different in wave structure than the 2002-2007 bull market. That bull market was completing a Primary wave V and it unfolded in five Major waves, with Major wave 5 extended. Our current bull market is Cycle wave [1] and it is unfolding in five Primary waves, with waves I and III the likely extensions.
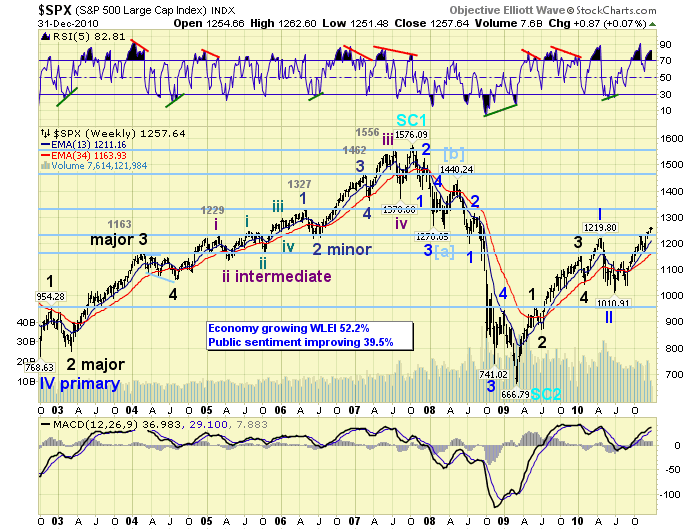
From the Mar 09 SPX 667 low we have counted five Major waves up to complete Primary wave I: Major 1 SPX 956 Jun09, Major 2 SPX 869 Jly09, Major 3 SPX 1150 Jan10, Major 4 SPX 1045 Feb10, and Major 5 SPX 1220 Apr10. After Primary wave I completed at SPX 1220, a three month Primary wave II unfolded into a SPX 1011 low in Jly10. Primary wave II (SPX 1011) found support just under Major wave 4 (1045), and retraced exactly 38.2% of Primary wave I. Currently the market has been uptrending since the Jly10 low in Major wave 1 of Primary wave III. When this uptrend concludes the market should correct in a Major wave 2. Then Major waves 3 – 4 - 5 should follow to complete Primary wave III in the second half on 2011. Our tentative bull market roadmap was published in September: http://caldaro.wordpress.com/2010/09/26/spx-bull-market-projection/.
MEDIUM TERM: uptrend high SPX 1263
This Major wave 1 uptrend is close to entering its sixth month. The previous three Major waves of this bull market have been respectively three months, six months and two months in duration. Therefore, on the time factor alone we should be looking for a conclusion to Major wave 1 in Jan11.
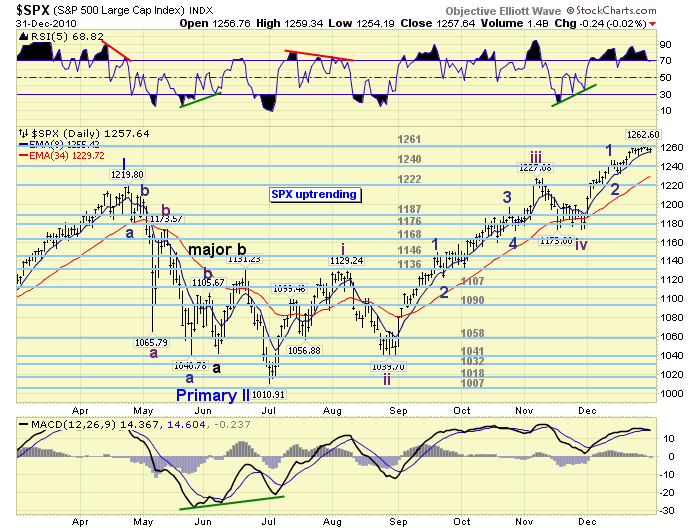
Thus far Major wave 1 has unfolded in the typical five Intermediate waves: Int. one SPX 1129 Aug10, Int. two SPX 1040 Aug10, Int. three SPX 1227 Nov10, Int. four SPX 1173 Nov10, and Int. five currently underway. Fibonacci price relationships suggest Major wave 1 could end between the OEW 1291 and 1313 pivots. At the 1291 pivot, Intermediate wave five equals Int. wave one, and is 61.8% of Int. wave three. At the 1313 pivot, Int. wave five is 61.8% of Intermediate waves one through three. This latter pivot was our projection in September.
SHORT TERM
Support remains at 1240 and then 1222, with resistance at 1261 and then 1291. Short term momentum displayed a slight positive divergence at friday’s low and then turned higher. Once the SPX closes above the 1261 pivot and clears its seven point range, the market should be heading to the next pivot at 1291. After that we’ll just have to decipher these smaller waves in an attempt to determine the end of this uptrend.
Intermediate wave five has been unfolding in five Minor waves: Minor wave 1 SPX 1247, Minor wave 2 SPX 1233, and Minor wave 3 currently underway. We have also labeled a potential Minute wave one and Minute wave two, of Minor wave 3, on the SPX hourly chart. Minor wave 3 is subdividing into the typical five Minute waves. As you can observe, during bull markets, each uptrend (significant wave) subdivides into five waves of a lesser degree. This is the Elliott Wave, the collective market psychology in action. It certainly is quite amazing to follow!
Overhead resistance remains at the 1261 pivot then 1291 beyond that. Short term support is in the mid-1250′s and then the 1240 and 1222 pivots after that. Should the market drop down to the 1240 pivot our short term count is in question. Should the market drop down to the 1222 pivot this uptrend is likely over. Best to your trading!
FOREIGN MARKETS
Asian markets were mixed with a net gain of 0.2%. Two of the five indices remain in downtrends, but Hong Kong’s HSI is close to confirming an uptrend.
European markets were all lower on the week for a net loss of 2.2%. Only Switzerland’s SMI remains in a downtrend.
The Commodity equity group were all higher for a net gain of 0.6%. Only Brazil’s BVSP remains in a downtrend, but is close to confirming an uptrend.
The DJ World index remains in an uptrend and gained 0.8% on the week.
COMMODITIES
Bonds were +0.7% on the week. At this week’s lows Bond prices displayed a positive divergence on the daily chart, with a deeply oversold reading on the weekly chart. Also the 30YR yield displayed a negative divergence after last week’s high of 4.62%. The recent trend may be reversing.
Crude continues to uptrend but slipped 0.1% on the week.
Gold gained 3.0% this week and remains in an uptrend. Uptrending, and leading, Silver neared $31 on friday. Gold’s potential diagonal fifth wave looks nearly complete. Silver has done five waves up from its Novemver $25 low, with many negative divergences. The nearly six month old uptrends may be nearing an end.
The USD dropped 1.8% this week and is now downtrending. The EUR gained 2.0% this week confirming an uptrend. The JPY gained 2.2% on the week and is very close to confirming an uptrend as well. The CHF, AUD, CAD and ZAR are all in uptrends.
NEXT WEEK
Busy week ahead to start the year. On monday, Construction spending and ISM manufacturing at 10:00. Tuesday, Factory orders, Auto sales and the FOMC minutes. Then on wednesday, ADP and ISM services. Thursday, we have the weekly Jobless claims. Then on friday, the Payrolls report, along with, the Unemployment rate and Consumer credit. The FED gets active on friday. FED chairman Bernanke gives Senate testimony, and FED governor Duke gives a speech in Balt., MD. On saturday there is a Quantitative Easing panel discussion , headed by FED vice chair Yellen, in Denver, CO. Best to your week, month and year!
CHARTS: http://stockcharts.com/def/servlet/Favorites.CServlet?obj=ID1606987
http://caldaroew.spaces.live.com
After about 40 years of investing in the markets one learns that the markets are constantly changing, not only in price, but in what drives the markets. In the 1960s, the Nifty Fifty were the leaders of the stock market. In the 1970s, stock selection using Technical Analysis was important, as the market stayed with a trading range for the entire decade. In the 1980s, the market finally broke out of it doldrums, as the DOW broke through 1100 in 1982, and launched the greatest bull market on record.
Sharing is an important aspect of a life. Over 100 people have joined our group, from all walks of life, covering twenty three countries across the globe. It's been the most fun I have ever had in the market. Sharing uncommon knowledge, with investors. In hope of aiding them in finding their financial independence.
Copyright © 2010 Tony Caldaro - All Rights Reserved Disclaimer: The above is a matter of opinion provided for general information purposes only and is not intended as investment advice. Information and analysis above are derived from sources and utilising methods believed to be reliable, but we cannot accept responsibility for any losses you may incur as a result of this analysis. Individuals should consult with their personal financial advisors.
© 2005-2022 http://www.MarketOracle.co.uk - The Market Oracle is a FREE Daily Financial Markets Analysis & Forecasting online publication.