


The Indian Economic Growth Story: Steady and Sure!
Economics / India Jan 07, 2011 - 10:51 AM GMTBy: Justin_John

 India has withstood the global crisis beyond most would have expected. Even while the rest of the world has been recovering, India and China (credibility of growth is at stake) have not only bounced back but has now started to grow at a very steady and sure rate. In fact a quick glance at S&P and Sensex performance over the last 10 years, will highlight the incredible performance of this much ignored economy.

Indian markets have grown 10x while S&P gives 0% return
A quick analysis of the difference facets of this growth should give us ample data to compare the Indian story8 with that of US, Brazil and China.
1. GDP Growth
Indian economy has somewhat maintained consistency in growth for the past four quarters. The basic economic indicators are quite robust and are expected to continue to be steady in the near to medium term. Inflation has been an area of concern. In the past six months, its average growth rate has been 9.8% which prompted RBI to take measures that led to firming up of interest rates.
Current macro economic indicators point to the sustainability of economic growth in fiscal year 2010-11. Better performance of agriculture on account of good monsoons coupled with higher growth in industry and service sectors are expected to buttress the economic performance. GDP is expected to post 8.5% growth in the fiscal 2010-11. Growth of individual sectors according to DES is given below:
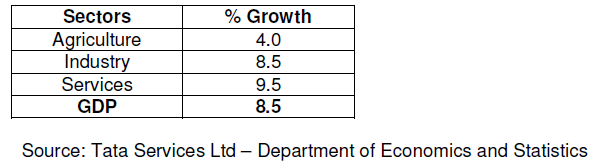
Current macro economic indicators point to the sustainability of economic growth in fiscal year 2010-11. Better performance of agriculture on account of good monsoons coupled with higher growth in industry and service sectors are expected to buttress the economic performance. GDP is expected to post 8.5% growth in the fiscal 2010-11. Growth of individual sectors according to DES is given below:
2. Industrial Growth
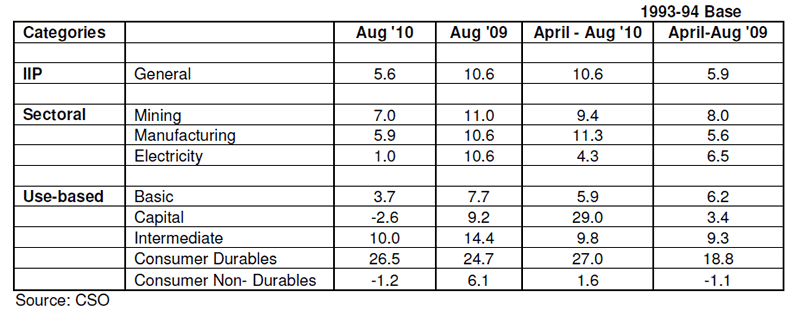
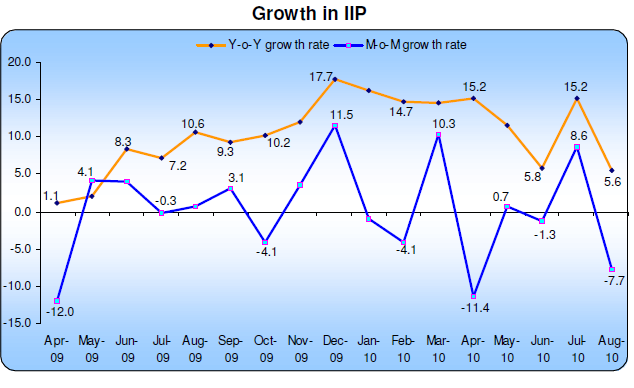
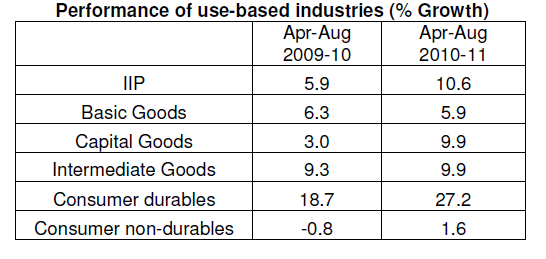
On the industrial front, the general Index of Industrial Production (IIP) registered 10.6% growth during the first five months (April-August) of 2010-11 as compared to 5.9% during the same period last year. Manufacturing sector which accounts for nearly 4/5th of the weightage grew by 11.3% as compared to 5.6% during the same period last year. growth in IIP slowed to 5.6% from 15.2% in the previous month. Industrial output continues to be volatile.
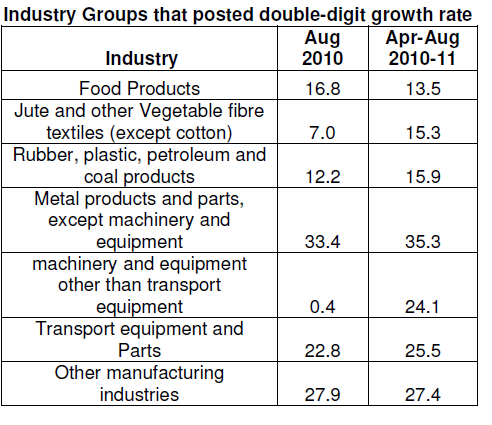
In August ’10 Mining, Manufacturing and Electricity sectors grew at 7.0%, 5.9% and 1.0%, respectively. Lower growth in manufacturing and electricity pulled down the IIP growth in August 2010. The industrial growth seems to be broad based as indicated by the number of growing industries. 14 out of 17 industry groups have shown positive growth in August 2010 as compared to the corresponding month of the previous year. What is more interesting is that out of the 14 industry groups, 7 groups witnessed double-digit growth rates. Double-digit growth has taken place in industries like transport equipments, metal products & parts and machinery and equipment. These are the industries having backward and forward linkages. Their growth is linked to the growth of sectors like automobile and steel which have also shown a much better performance as compared to the previous fiscal. It is noteworthy that most of the growth has taken place in the capital intensive sectors. Labour-intensive sectors like textiles and wood posted a flat or even negative growth rate. Wood and wood products industry grew at a negative rate of 10.6% during April to August period of 2010-11.
The industrial growth seems to be broad based as indicated by the number of growing industries. 14 out of 17 industry groups have shown positive growth in August 2010 as compared to the corresponding month of the previous year. What is more interesting is that out of the 14 industry groups, 7 groups witnessed double-digit growth rates. Double-digit growth has taken place in has taken place in industries like transport equipments, metal products & parts and machinery and equipment. These are the industries having backward and forward linkages. Their growth is linked to the growth of sectors like automobile and steel which have also shown a much better performance as compared to the previous fiscal. It is noteworthy that most of the growth has taken place in the capital intensive sectors. Labour-intensive sectors like textiles and wood posted a flat or even negative growth rate. Wood and wood products industry grew at a negative rate of 10.6% during April to August period of 2010-11.
On M-o-M basis, IIP growth has been highly volatile. It declined to as low as negative 11.4% in April 2010. Performance of use-based industry is encouraging. Growth in the case of capital goods and consumer durables is a low base effect. Overall growth has been encouraging although sustainability of such a high growth is questionable amidst increasing interest costs.
3. Infrastructure Index
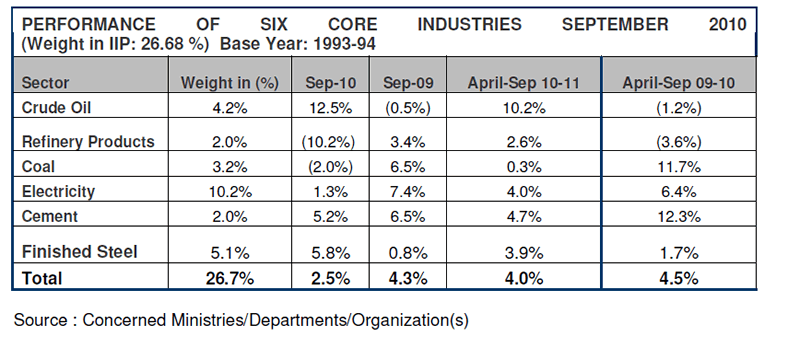
The Index of Six core industries having a combined weight of 26.7 per cent in the Index of Industrial Production (IIP) registered a lower growth of 2.5% in September 2010 as compared to 4.3% registered in September 2009. This growth was also lower as compared to 3.9% recorded in the just preceding month of August ’10 and the lowest in the first six months of the current fiscal. During April-September 2010-11, the six core industries registered a growth of 4% as against 4.5% registered during the corresponding period of the previous year.
The key energy sectors comprising of coal, electricity and petroleum refinery products recorded an abysmal growth of -2%, 1.3% and -10.2% respectively which pulled down the growth of the overall infrastructure index. Lower growth in the key energy sectors is an area of concern. However, the key infrastructure segments comprising of cement (+5.2%) and steel (+5.8%) recorded better growth as compared to the growth recorded in the last three months. This is because the infrastructure development has picked up post the monsoons.
With high weightage sectors like electricity (10.2% weight in IIP) showing lower growth for the second straight month, IIP for September 2010 is expected to remain subdued and may even record a low single digit growth.
4. Inflation
After peaking in the first month of the current fiscal, April 2010-11 to 11.0% on a Y-o-Y basis, Headline inflation eased in the consecutive months. In September 2010, WPI witnessed only a marginal increase of 8.6% (Y-o-Y) from 8.5% in the previous month. However, on M-o-M basis, it firmed up to 0.6% from (-) 0.2%
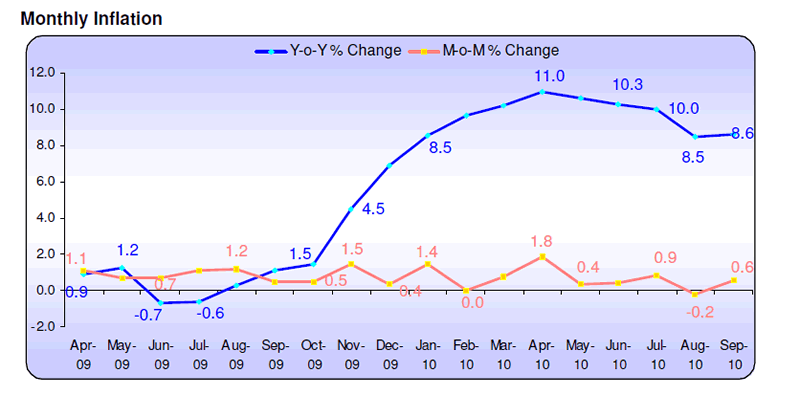
in the previous month. This increase is mainly due to higher inflation in primary group during the month, both in food and non-food.
Monthly InflationPrimary group inflation accelerated by 17.5% (Y-o-Y) in September 2010 from 15.8 (Y-o-Y) in August 2010. In the same month, it posted an increase of 1.5% (M-o-M) from (-) 0.4% in August 2010.
Fuel inflation in September 2010 softened to 11.1% (Y-o-Y) from 12.5% in the previous month. This is on account of coal, petrol, diesel and LPG prices remaining unchanged. In addition to this, lower prices of Aviation Turbine Fuel, naphtha and bitumen also lowered the inflation in fuel category.
Manufacturing inflation moderated in September 2010 to 4.6% (Y-o-Y) from 4.8% (Y-o-Y) in August 2010. This is on account of decline in non-food manufacturing inflation to 4.6% (Y-o-Y) from 4.5% in the previous month.
Current inflation has largely been driven from the supply side developments. The food inflation has started moderating too. In order to bring about some parity between crude prices and the price charged to customers of petroleum products, government also raised the price of administered fuel prices.
Core Inflation
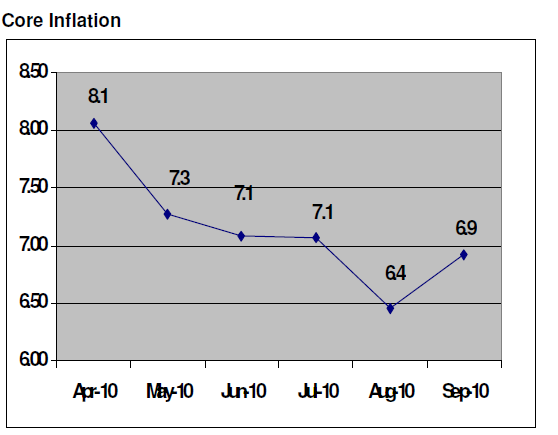
Source: Tata Services Ltd – Department of Economics and Statistics
However, in core inflation, which is a measure of inflation rate, excluding food and fuel has started coming down (see aligned graph). Secondly, RBI has taken the key policy rate up five times since March 2010.
This has little impact on inflationary expectations as it emanated from the supply side and not from the demand side. With a likelihood of a higher kharif output, food inflation is expected to come down by December 2010. We expect food inflation to stabilize in the last quarter of the fiscal 2010-11, i.e. January 2011 to March 2011 and overall inflation will be around 5.5% to 6.0%.
5. Interest rates
In its mid-quarter policy review on 16th September 2010, the Reserve Bank of India (RBI) hiked the key ‘Repo’ rate by 25 bps from 5.75% earlier to 6% and the ‘Reverse Repo’ rate by 50 bps from 4.5% earlier to 5%. With these hikes, the RBI has raised, in total, the ‘Repo’ rate to the tune of 125 bps and the ‘Reverse Repo’ rate by 175 bps since March this year when it began the tightening process. In the previous as well as the current policy review, the hike in Reverse Repo rate was more than that in the Repo rate. This move reduced the gap between the 2 rates (from 150 bps to 100 bps) aiming at stability in the short term rates and strengthening the transmission of the policy rates to market rates.
In the second quarter policy review on 02nd November 2010, the RBI further increased the policy rates, Repo Rate and Reverse Repo Rate by 25 basis points with immediate effect. The cash reserve ratio (CRR) has been left unchanged at 6%. It is noteworthy that RBI has increased the policy rates six times so far since it started with the monetary tightening process in March 2010. With this increase, the repo rate has increased by 150 basis points and the reverse repo by 200 basis points. The current rates are:
(i) the Repo Rate (the rate at which the RBI lends to banks) 6.25%
(ii) the Reverse Repo rate (The rate at which liquidity is made available) 5.25%
With the above monetary measures the RBI hopes to contain inflation and anchor inflationary expectations going forward without hurting the recovery process.
In a tight liquidity situation, hike in the policy rates will eventually get transmitted to the market rates going forward, albeit with a lag. This will have an impact on sectors like automobile and housing. Higher interest cost will lead to the higher cost of auto loans and coupled with rising fuel prices will impact the demand of automobiles.
6. Freight Rates
As on 25th September 2010, freight rates stood at 174.31. On an average, the freight rates in the second quarter were higher than the previous quarter by 0.5%. Freight rates in September 2010 increased by 1.76% as compared to last year. Effective September 8th 2010, diesel prices (in Mumbai) stands at Rs. 42.06 /litre, higher by 14.60% over last year. Increasing diesel prices and freight rates will lead to a rise in operating costs of the transporters and reduce profits.
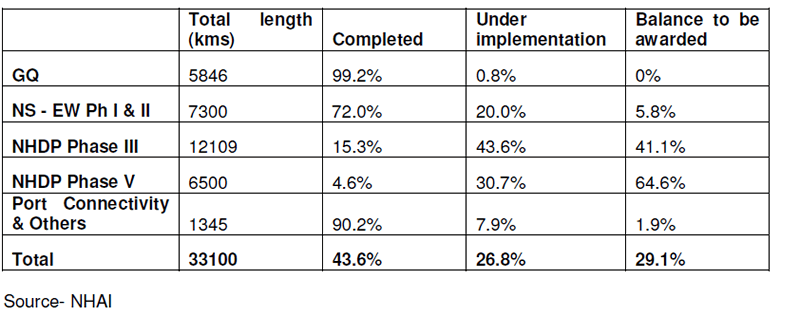
7. National Highway Development Project (NHDP)
The NHDP projects are divided into seven phases. However the ones being implemented are in four phases, i.e. I, II, III and V. Projects implemented in phase IV and VII are only a small percentage of the total length in respective phases. There has been no progress on projects in phase VI. (Phases IV, VI and VII are excluded from the table below) 43.6% of the national highway development and other road projects under NHAI were completed as on 30th September 2010. In NHDP, 168 kms of 4-laned roads were added and the projects under implementation increased by 190 kms in the period July-September 2010. During the same period, 7 kms were added in the port connectivity and other projects of NHAI. The GQ is almost complete while Port Connectivity and other projects of NHAI are also very close to completion. Status of NHDP as on 30th September 2010:
Conclusion
The Indian growth story is far from over. India has shown real progress in the last decade and there is nothing in the data, that India is anywhere close to a slowdown even with RBI raising rates over the last few months and set to continue well into 2011.
If there are complains about the growth story, it is that India could have done even better if only India were blessed with a set of honest ministers thus bringing down the level of corruption in India and hence the cost to doing business.
Happy 2011 Investing.
By Justin John
Justin John writes for DawnWires.com and is a Director at a European Hedge Fund.
© 2010 Copyright Justin John - All Rights Reserved Disclaimer: The above is a matter of opinion provided for general information purposes only and is not intended as investment advice. Information and analysis above are derived from sources and utilising methods believed to be reliable, but we cannot accept responsibility for any losses you may incur as a result of this analysis. Individuals should consult with their personal financial advisors.
© 2005-2022 http://www.MarketOracle.co.uk - The Market Oracle is a FREE Daily Financial Markets Analysis & Forecasting online publication.