


Dow Stock Market Index Interim Trend Analysis and Forecast Update
News_Letter / Stock Markets 2011 Jan 31, 2011 - 12:32 AM GMTBy: NewsLetter
 The Market Oracle Newsletter
Jan 24th, 2011 Issue #2 Vol. 5
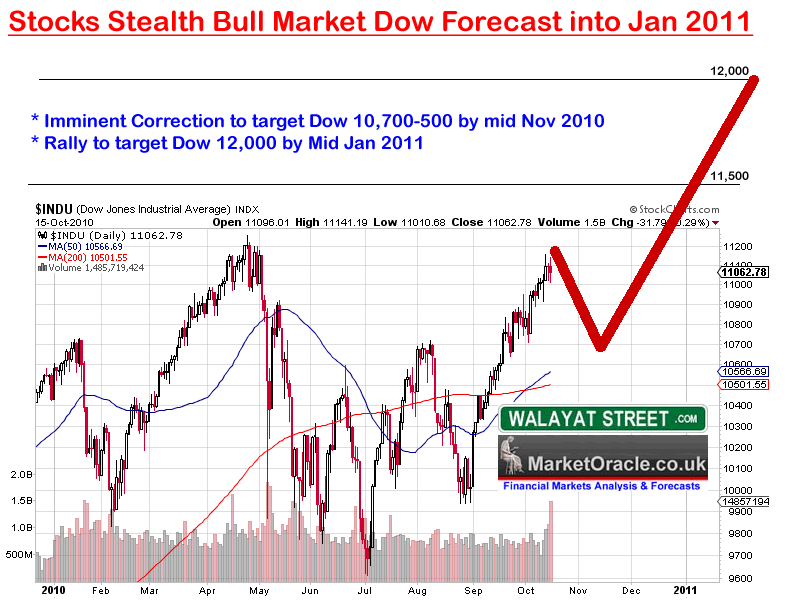
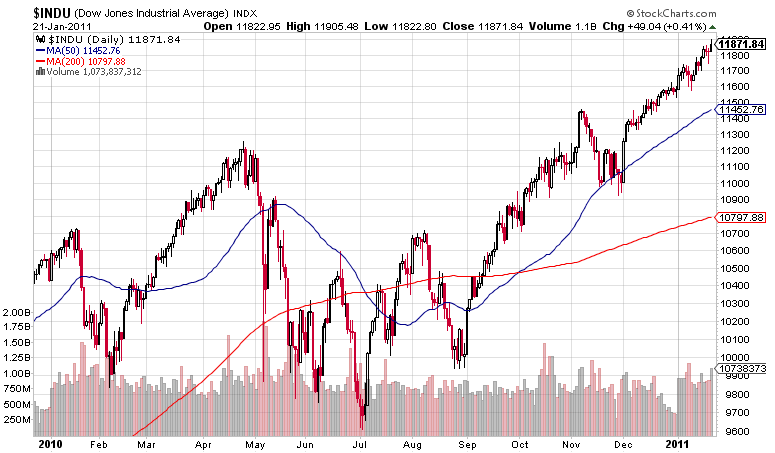
Dow Stock Market Index Interim Trend Analysis and Forecast UpdateInflation Mega-Trend Ebook Direct Download Link (PDF 3.2m/b) Dear Reader The stock market spent most of the week trading sideways in a tight range into Fridays break higher to a new bull market closing high of Dow 11871.84. However minor weakness during early to mid week was enough to get many perma-bears with itchy fingers to short and lose more money on the so called bear market rally (approaching 2nd anniversary). Some even went so far as to resurrect the worthless Hindenberg Crash Omen, as they wait for the one time when it actually delivers something other than trading losses, though a coin toss has repeatedly shown itself to be infinitely more profitable than the likes of the hindenberg crash omen. My last in depth analysis and concluding forecast for the Dow projected a trend higher into Mid January 2011 to target Dow 12k as illustrated by the below original graph (18 Oct 2010 - Stocks Stealth Bull Market Dow Trend Forecast into Jan 2011).
Which compares against the Dow's actual trend path:
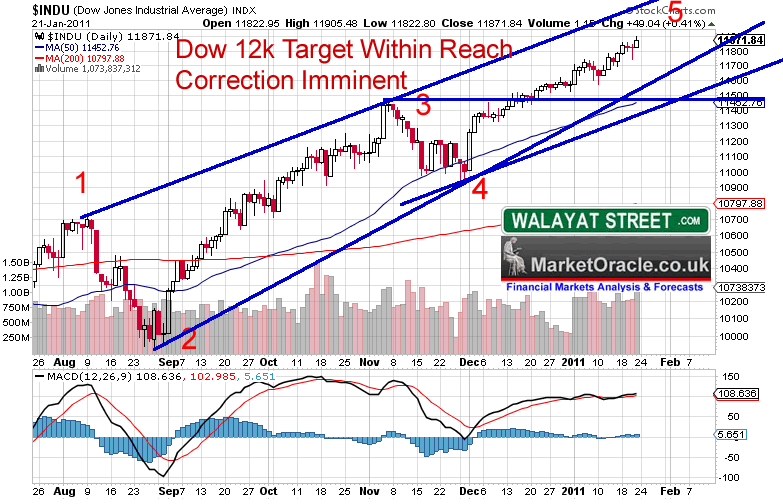
The focus of my current in depth analysis follows on from last weeks UK Inflation Forecast (17 Jan 2011 - UK Inflation Forecast 2011, Imminent Spike to Above CPI 4%, RPI 6%) on coming to a trend conclusion for UK interest rates during 2011. However, this interim analysis is in response to a number of requests for an update on the Dow ahead of the next in depth analysis that is anticipated by Mid Feb 2011. Where trading the Dow and other stock indices is concerned, in-depth analysis concludes in targets for positions, for the primary purpose that following entry of a trading position no further analysis is required until the target (limit) is achieved and the position is exited, or money money management (stops) exit the position on negation of the trade scenario. Where the 12,000 target / forecast for the Dow is concerned, the Dow has done NOTHING so far to negate the existing scenario, nor has it resulted in a trend since the start of December that can be termed as being anything other than a market that is trending higher on auto-pilot. So the Dow still targets Dow 12k, regardless of whether mid January has come and gone, because one trades the price not the anticipated trends which at the end of the day are best guesses utilised to measure relative strength and weakness. Which I will cover at length in a forthcoming ebook on the Real Secrets of Successful Trading (Due March 2011 - FREE to the Market Oracle readership). Dow Stock Index Analysis Market Psychology - Frustrated perma-bears continue to lose money for themselves and anyone that still cares to listen to what they spout as their stops are hit and options expire worthless. The behaviour patterns of the perma-bears with their bear market rally commentary continues to play out as I anticipated within a few weeks of the March 2009 low. Which illustrates the worthless of the whole thesis of the "bear market rally" that is has scared many small investors from monetizing on a near 100% bull run and more on other indices. The stocks stealth bull market on Friday closed above 8,000 on BAD U.S. unemployment data, having rallied near 24% from the low of 6470, as expected the rally is STILL predominantly perceived as a Bear Market rally that contrary to some statements is still being AVOIDED by ALL but the Smart Money! Yes after the market has moved 24%, EVERYONE IS STARTING TO HAVE SEEN THIS RALLY COMING ! - BUT NO ONE (me included) can invest or trade in a trend that they perceive as being corrective, secondary, inferior, an aberration, a subversion of the mighty bear market that seeks ever greater explanations of why it still remains intact, forget the 20% bull / bear reversal rules, instead lets hark back in time to the instances where bear market rallies could rally much further so as to always reinforce the distant juncture hypothesises, 20%, 30%, 40% ! FORTY PERCENT! STILL a Bear market Rally ? , Will it Always Be a Bear Market Rally ? As ever bears are at their most vocal at market correction bottoms, and have tended to emerge on every down day for virtually the past 2 months to call an end to the so called bear market rally. However a fact that they are unable to realise is that the stocks rally off of the March 2009 lows (15 Mar 2009 - Stealth Bull Market Follows Stocks Bear Market Bottom at Dow 6,470 ) that set a new high on Friday is longer in duration than the preceding bear market from October 2007 to March 2009! Last weeks minor intra-week dip will have given the bears (especially on other indices) another opportunity to throw more good money after bad which implies Dow 12k is likely to be achieved over the coming week as futures and options positions result in more losses for those that fight the prevailing trend. Off course many of those of the bearish commentate that particularly infects the blogosfear don't actually trade for the 95% rally of approaching 2 years would have already bankrupted perma-bears several times over by now, especially as many of the calls are at their most intense at market correction bottom as observed during Mid 2010 (22 Aug 2010 - The Hindenburg Stock Market Omen Doomed to Crash and Burn? ). So I will leave the perma bears to finance the profits of the zero sum trading game as they keep shorting a market that continues to make NEW BULL MARKET HIGHS ! For some reason many commentators confuse analysis with looking for what supports ones pre-existing point of view. Instead market analysis should be starting from a BLANK FLAT position, and then let the market talk you into the most probable direction to trade, and always remember that ANY TECHNICAL TOOL or Indicator or theory in the long-run WILL NEVER BE MORE RELABLE THAN A COIN TOSS!
Elliott Wave Theory - The trend continues to resolve towards the October 2010 wave pattern for the current rally being a 5th wave, which implies it will terminate in a significant correction in time and price (at least 10%). Given that the Dow target of 12k is nearby, the correction appears not far off. TIME ANALYSIS - Suggests the rally has the potential to continue into mid Feb 2011. TREND ANALYSIS- The Dow continues to march higher targeting resistance at 12,000 and beyond, with no technical sign of a reversal. Support lies at Dow 11,500 that would likely be the first target for any downtrend during Feb, then Dow 11,000. Conclusion Firstly, whatever the stock market does over the next few weeks i.e. corrects or trends higher, one thing that continues to be reinforced by the price action is that the bears are going to suffer a lot more pain during 2011 because this bull market is far from over. The above analysis is concluding towards probability favouring continuation of the trend higher to the Dow 12k target by early Feb, when the market can be expected to consolidate the advance of the past 6 months and enter into a significant correction that at this point suggests a 10% decline, so tighten the stops and take the ongoing rally to bank profits which is the number one AIM of trading / investing! The target date for my next stocks in depth analysis will accompany the expected correction (Mid Feb 2011) which will aim to replicate the forecast trend of 2010 (02 Feb 2010 - Stocks Stealth Bull Market Trend Forecast For 2010) and map out the trend for the Dow into the end of 2011. Ensure you remain subscribed to my always free newsletter to get my next in depth analysis on the stock market in your email in box, not forgetting my next ebook on the Real Secrets of Successful Trading (Due march 2011). Your analyst, keeping an eye on the bankrupt banks..... (next in-depth analysis). Source and Comments: http://www.marketoracle.co.uk/Article25805.html By Nadeem Walayat Copyright © 2005-11 Marketoracle.co.uk (Market Oracle Ltd). All rights reserved.
Disclaimer: The above is a matter of opinion provided for general information purposes only and is not intended as investment advice. Information and analysis above are derived from sources and utilising methods believed to be reliable, but we cannot accept responsibility for any trading losses you may incur as a result of this analysis. Individuals should consult with their personal financial advisors before engaging in any trading activities.
You're receiving this Email because you've registered with our website. How to Subscribe Click here to register and get our FREE Newsletter To access the Newsletter archive this link Forward a Message to Someone [FORWARD] To update your preferences [PREFERENCES] How to Unsubscribe - [UNSUBSCRIBE]
The Market Oracle is a FREE Financial Markets Forecasting & Analysis Newsletter and online publication. |
||||||||||||||
© 2005-2022 http://www.MarketOracle.co.uk - The Market Oracle is a FREE Daily Financial Markets Analysis & Forecasting online publication.