


The U.S. Dollar Index, How Low Can You Go?
Currencies / US Dollar Feb 03, 2011 - 02:46 AM GMTBy: Guy_Lerner

 When looking at the Dollar Index, I am reminded of the song the "Cha Cha Slide"when the performer says, "How low can you go?" There is no question investors believe that the Dollar is going down and that equities are only going up all courtesy of Federal Reserve Chairman Bernanke and his QE 2 policy. Yesterday's rally in equities and concurrent drop in the Dollar served to remind me of the fact that currency devaluation and increasing liquidity remain the drivers for equities. It has been that way since 2007, and why should it stop now? For the record, the Dollar Index was down a hefty 0.86% yesterday while stocks enjoyed a strong trend day.
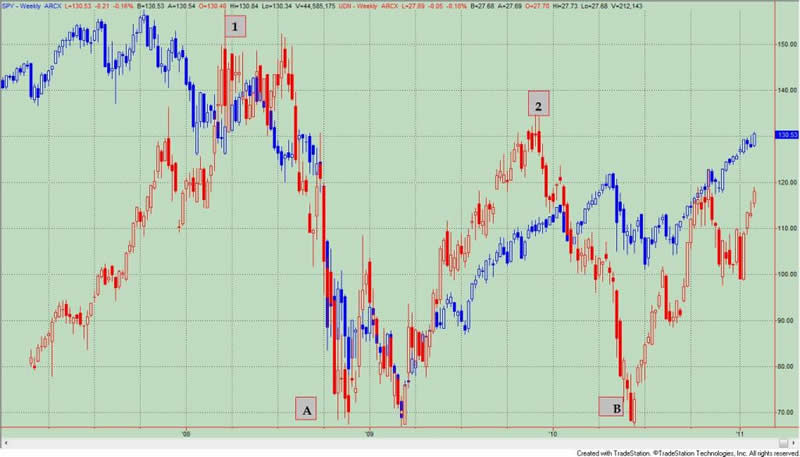
The relationship between the Dollar and the SP500 can be seen nicely in this weekly chart. See figure 1 with the S&P Depository Receipts (symbol: SPY) in blue and the PowerShares DB US Dollar Bear (symbol: UDN) overlaid in red. UDN moves inversely to the Dollar Index, and for our purposes here, UDN remains highly correlated to the SPY. For example, at points 1 and 2, the UDN peaked (or the Dollar bottomed) and stocks subsequently struggled. Similarly, at points A and B, UDN bottomed (or the Dollar peaked), and equities found better footing. There is probably nothing new here, but this relationship certainly serves as a reminder of what is driving stocks.
Figure 1. SPY v. UDN
But let's get back to our question: "How Low Can You Go?" Investors believe there is no limit to the "mad man" Bernanke; he will stop at nothing to devalue the Dollar and pump up stocks. While this is widely believed, a weekly chart of the Dollar Index says differently. See figure 2.
Figure 2. Dollar Index/ weekly
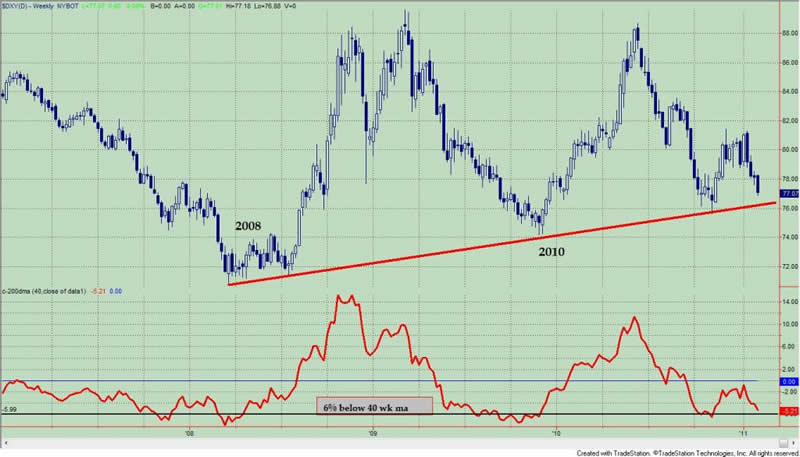
Although the Dollar Index has been crushed, it really has been crushed all the way back to trend line support, and this is trend line support going back to the bottom in the Dollar in 2008. This is a rising trend line formed by a series of higher lows, and this is bullish until it isn't. In essence, the trend line has yet to be violated and most importantly, it has yet to validate the belief held by investors that Bernanke and company are out to devalue the currency. In addition and what should be readily apparent, the Dollar Index is at a critical level. Failure of this trend line to hold, and it is lights out for the greenback, and equities (and all assets for that matter), which have been acting like all is well, should go ballistic to the upside. How else can you interpret it?
What is the likelihood that the Dollar Index will bounce? Return to figure 2 and look at the indicator in the lower panel. The indicator measures the distance that the current price is from its 40 week moving average. The Dollar will normally find a bottom (temporarily or tradeable) when it is about 6% below the 40 week moving; the current value is 5.28%.
Once again, the Dollar Index remains the key for equities. The Dollar Index is at an important level, and failure here will validate the notion that Ben Bernanke is really out to destroy the greenback.
So "How Low Can You Go?" We are about to find out.
To subscribe to Premium Content click here: Subscribe
By Guy Lerner
http://thetechnicaltakedotcom.blogspot.com/
Guy M. Lerner, MD is the founder of ARL Advisers, LLC and managing partner of ARL Investment Partners, L.P. Dr. Lerner utilizes a research driven approach to determine those factors which lead to sustainable moves in the markets. He has developed many proprietary tools and trading models in his quest to outperform. Over the past four years, Lerner has shared his innovative approach with the readers of RealMoney.com and TheStreet.com as a featured columnist. He has been a regular guest on the Money Man Radio Show, DEX-TV, routinely published in the some of the most widely-read financial publications and has been a marquee speaker at financial seminars around the world.
© 2011 Copyright Guy Lerner - All Rights Reserved
Disclaimer: The above is a matter of opinion provided for general information purposes only and is not intended as investment advice. Information and analysis above are derived from sources and utilising methods believed to be reliable, but we cannot accept responsibility for any losses you may incur as a result of this analysis. Individuals should consult with their personal financial advisors.
Guy Lerner Archive |
© 2005-2022 http://www.MarketOracle.co.uk - The Market Oracle is a FREE Daily Financial Markets Analysis & Forecasting online publication.