


What is the VIX Directional Tendencay Indicator Prior to US Interest Rate Annoucement and Market Risk Analysis
Interest-Rates / US Interest Rates Oct 31, 2007 - 02:09 PM GMTBy: Marty_Chenard

 In this update, we will cover : 1.) What the VIX Directional Tendency Indicator is saying prior to Bernanke's announcement today. 2.) Part 2 of the Study on: What our Inverse Data Study is saying about market conditions and risk levels.
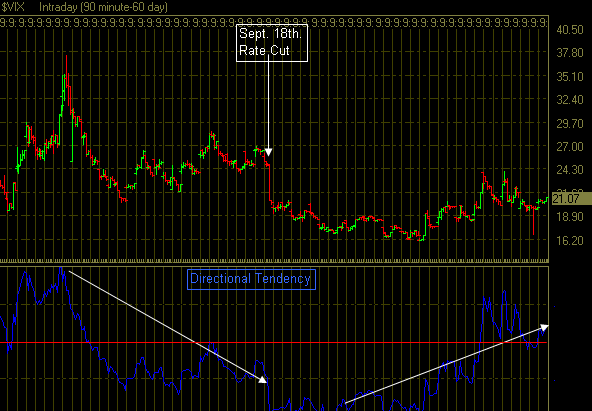
1.) The VIX (Volatility Index) is telling an interesting story as we wait for Bernanke's decision this afternoon.
I plotted the 90 minute chart and a "directional tendency indicator" in the chart below. Take a look at the Directional Tendency Indicator for the weeks prior to the Sept. 18th. Rate Cut. The indicator moved down and was below the horizontal equilibrium line. True to expectation, the Fed cut rates and the VIX had a large drop that afternoon.
Now look at the white line with the arrow for what the Directional Tendency Indicator is saying for the VIX today and we wait for Bernanke's announcement. The indicator has moved up for the past few weeks and it is now ABOVE the red equilibrium line.
What is this saying? It points to the expectation that the VIX will rise higher in the coming days. For it to rise higher, the market would have to be dissatisfied with Bernanke's decision today. It could also be pointing to the fact that the market believes that there is no good solution for Bernanke at the point ... something will have to be sacrificed, the Dollar or the Housing industry.
| Part 2: Inverse market data and how it correlates with Rally and Corrections turning points ... |
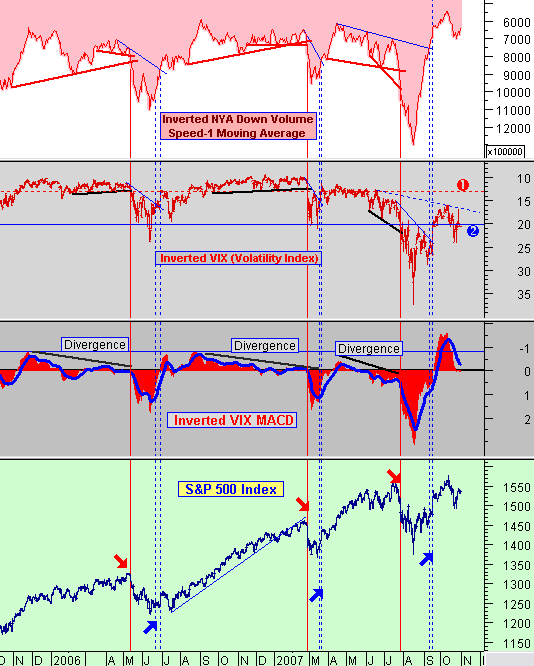
2.) Yesterday, we analyzed two inverted sets of data . The first one was the NYA (New York Stock Exchange) Down Volume. The second one was the familiar VIX (Volatility Index).
The final result was a good correlation showing when the market was starting a new Rally or starting to go into correction. See this link if you haven't read Part 1 yet: Part 1-Inverse Data Study. I won't repeat everything we said yesterday in explaining today's chart, you can go to the above link for that.
What we are doing this morning, is adding another dimension to the study, and we are doing that by adding an "inverted MACD indicator for the VIX". This adds a new dimension to the study that we didn't have before.
Before we go to the MACD implications, let me add a comment about the Inverted VIX ... the second graph from the top. The 3 previous rallies all had the inverted VIX at a reading close to 17 ... see the label 1 line with the red dotted horizontal line on the chart.
When the VIX would trend below that line, a correction ensued or was in the making. Those levels are quite different that what we have now . This morning, at 10:30 AM, the VIX was at 20.37. That's a level below Level 1, and in fact, slightly below Level 2. Additionally, it is below a down trending resistance line as seen on the graph.
From a VIX standpoint, the market is saying that it perceives risk levels to be very high ... even as we wait for Bernanke's announcement this afternoon. The offsetting compensation for this high VIX reading is the fact that the NYA Down Volume is so low . The low NYA Down Volume is showing an absence of selling levels that would match the normal range levels of 7000 to 8000 (x100,000). It is this absence of selling in the face of higher perceived risks that is keeping the S&P 500 from dropping. The danger here, is if selling accelerates to 9000 with this high risk level, then the market will see a sharp drop that could come close to retesting the previous low.
Now, let's look at the Inverted VIX MACD to see what light that sheds on this 2006-2007 analysis. The importance of the inverted MACD in this analysis is easy to spot. In each of the prior 3 cases where the market failed to the downside, the MACD showed a "clear divergence" from the S&P 500's upward price movement. Those were the warning signs to pay particular attention to, for when the inverted VIX and the inverted NYA Down Volume would break their support lines. When those supports were broken, the MACD's red mountain graph went negative, and the blue indicator also went below zero.
What we have now is quite different than the 3 previous scenarios in the following ways:
1. The NYA Down Volume is abnormally low.
2. The VIX is at a high risk level 2 reading.
3. The VIX-MACD has its red indicator reading at zero, and the blue indicator trending down.
Together, these indications support the fact that risk levels are now much higher than they were from November 2005 to July 2007. The critical, market supporting condition , in this equation, is now the low level of Down Volume on the NYA. If the VIX remains where it is now, and the selling just went to normal levels, then the market would likely go into correction again.
All of this makes Bernanke's announcement very important today. He has a tough problem to solve. He can opt for no rate cut and try to save the Dollar from falling further ... but not give investors what they want to help soften the housing crisis. Or, he can lower rates 25 basis points and hope that it satisfies everyone. The worse action would probably be to lower rates by 50 basis points and send the Dollar down further. From the Directional Tendency Indicator we plotted on the first chart today, the market consensus is that he will most likely cut 25 basis points. However, the Directional Tendency does not rule out the possibility of Bernanke announcing a zero rate cut.
By Marty Chenard
http://www.stocktiming.com/
Please Note: We do not issue Buy or Sell timing recommendations on these Free daily update pages . I hope you understand, that in fairness, our Buy/Sell recommendations and advanced market Models are only available to our paid subscribers on a password required basis. Membership information
Marty Chenard is the Author and Teacher of two Seminar Courses on "Advanced Technical Analysis Investing", Mr. Chenard has been investing for over 30 years. In 2001 when the NASDAQ dropped 24.5%, his personal investment performance for the year was a gain of 57.428%. He is an Advanced Stock Market Technical Analyst that has developed his own proprietary analytical tools. As a result, he was out of the market two weeks before the 1987 Crash in the most recent Bear Market he faxed his Members in March 2000 telling them all to SELL. He is an advanced technical analyst and not an investment advisor, nor a securities broker.
Marty Chenard Archive |
© 2005-2022 http://www.MarketOracle.co.uk - The Market Oracle is a FREE Daily Financial Markets Analysis & Forecasting online publication.