


U.S. Treasury Bonds TLT Technical Take
Interest-Rates / US Bonds Feb 26, 2011 - 04:19 AM GMTBy: Guy_Lerner

 It is my belief that we have seen the high in long term Treasury yields at least for a while, and I expressed this opinion in yesterday's article on Treasury yields. Today, I thought it would be instructive to look at the bullish technical patterns developing in the i - Shares Lehman 20 plus Year Treasury Fund (symbol: TLT).
Figure 1 is a weekly chart of the TLT. The black and pink dots represent key price levels. These are areas of support (buying) and resistance (selling). The red colored price bars are positive divergence bars, and clusters of divergence bars are typically seen at market bottoms and this can be seen (inside the gray ovals) in this bottom and the two prior intermediate term bottoms. Over the past couple of weeks, price actually closed below support levels at 89.38, but in the following week, price had reversed higher. This is a common pattern seen in many assets. Prices trade below support taking out stops, and then they quickly reverse trading back above resistance (old support) levels. A weekly close below 89.38 would nullify this set up.
Figure 1. TLT/ weekly
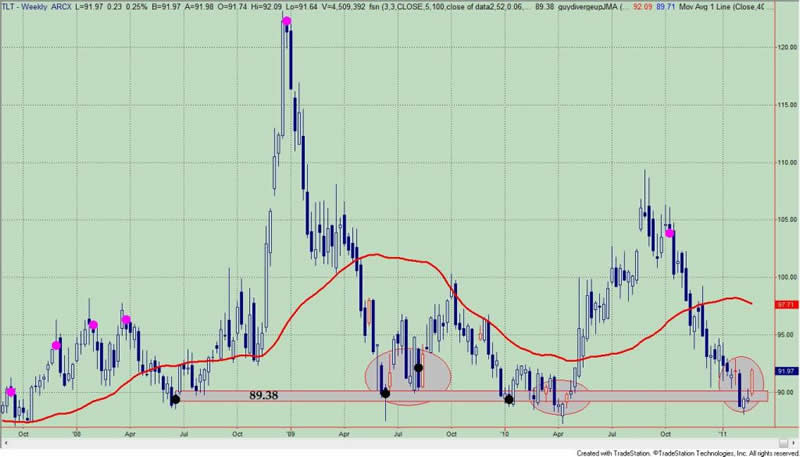
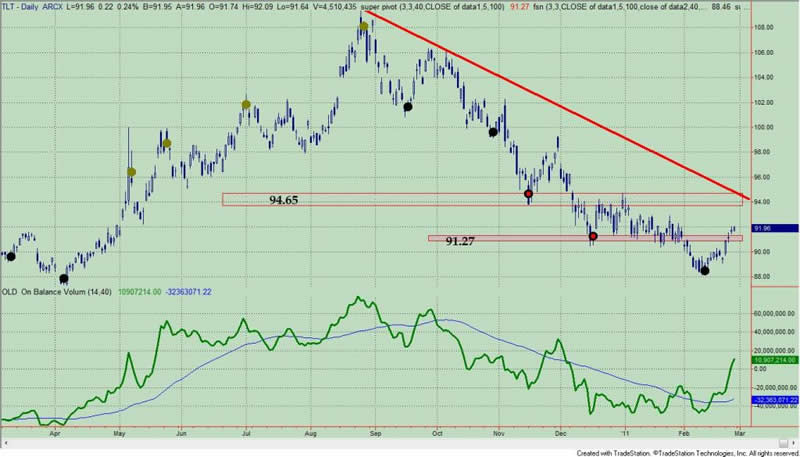
Figure 2 is a daily chart of TLT with the on balance volume (OBV) indicator in the lower panel. Key pivot points are on the price bars, and we note that TLT is trading above the immediate key pivot at 91.27. In addition, OBV is leading price higher. These are positives. An immediate price target would be at 94.65, which coincides with a key pivot resistance level and the down sloping trendline.
Figure 2. TLT/ daily
While the bottom for TLT (or top for TBT and yields) appears to be in, it is not clear whether this will lead to a sustainable move that would cause price to break the down sloping trend line seen in figure 2. My hesitation in making the call is my (yet to be presented) intermarket bond model. This model is still bearish on bonds, but it is not unusual for it to lag the technicals at this point. If the model turns bullish on bonds while the technical set up is developing, then I will have greater confidence in the sustainability of this price move.
By Guy Lerner
http://thetechnicaltakedotcom.blogspot.com/
Guy M. Lerner, MD is the founder of ARL Advisers, LLC and managing partner of ARL Investment Partners, L.P. Dr. Lerner utilizes a research driven approach to determine those factors which lead to sustainable moves in the markets. He has developed many proprietary tools and trading models in his quest to outperform. Over the past four years, Lerner has shared his innovative approach with the readers of RealMoney.com and TheStreet.com as a featured columnist. He has been a regular guest on the Money Man Radio Show, DEX-TV, routinely published in the some of the most widely-read financial publications and has been a marquee speaker at financial seminars around the world.
© 2011 Copyright Guy Lerner - All Rights Reserved
Disclaimer: The above is a matter of opinion provided for general information purposes only and is not intended as investment advice. Information and analysis above are derived from sources and utilising methods believed to be reliable, but we cannot accept responsibility for any losses you may incur as a result of this analysis. Individuals should consult with their personal financial advisors.
Guy Lerner Archive |
© 2005-2022 http://www.MarketOracle.co.uk - The Market Oracle is a FREE Daily Financial Markets Analysis & Forecasting online publication.