


Gold Dome Break Out Held at Resistance, Stocks Bearish Pattern
Commodities / Gold and Silver 2011 Feb 28, 2011 - 04:11 AM GMTBy: Clive_Maund

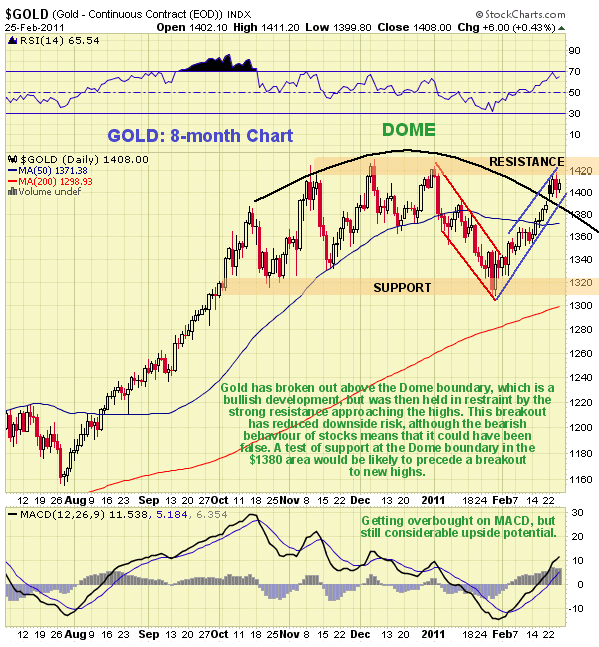
 Gold broke out above its Dome boundary last week, which was not what we were expecting. Fundamentally this action was due to fears relating to the worsening situation in Libya, and while this breakout is a bullish development, it has not as yet led to a breakout to new highs, and the bearish overall behaviour of PM stocks last week means that it could have been a fakeout.
On the 8-month chart for gold we can see the breakout, which, while not exactly breathtakingly robust, has improved the technical picture, especially as it has resulted in the 50-day moving average starting to turn up. On this chart it is clear that upon breaking out gold was immediately held in check by the strong resistance approaching the highs, which until now at least, has prevented further progress. This resistance level is of major importance and we can therefore presume that a breakout above it will lead to a strong advance. One scenario here that would be likely to precede a breakout to new highs is a reaction back to test what is now support at the upper Dome boundary currently at about $1380.
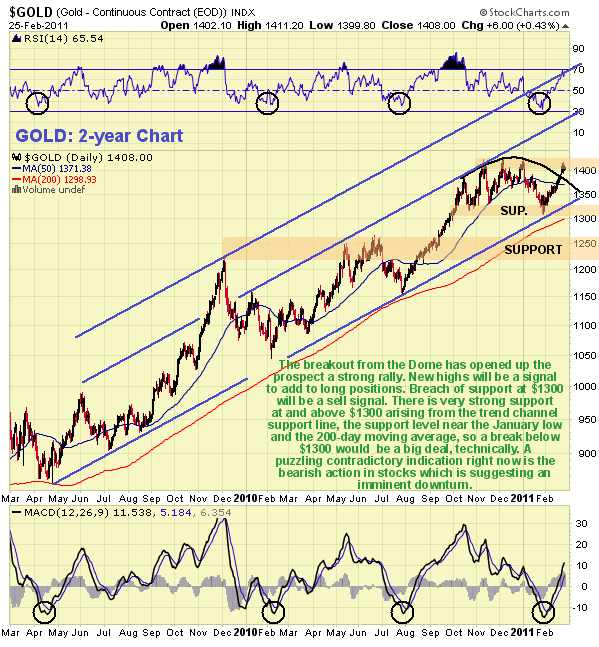
The 2-year chart for gold continues to look positive, but because of the growing importance of the strong resistance approaching the highs, those looking to go long or add to positions should wait for a clear breakout above $1430 before doing so, or otherwise wait for a favorable setup following a reaction. On the downside this chart makes clear the importance of the support at and above $1300 - for if this level should fail it would mean that gold would have to break below its supporting long-term trendline, the support level at the January low and the 200-day moving average. For these reasons a closing break below $1300 would be regarded as a negative development.
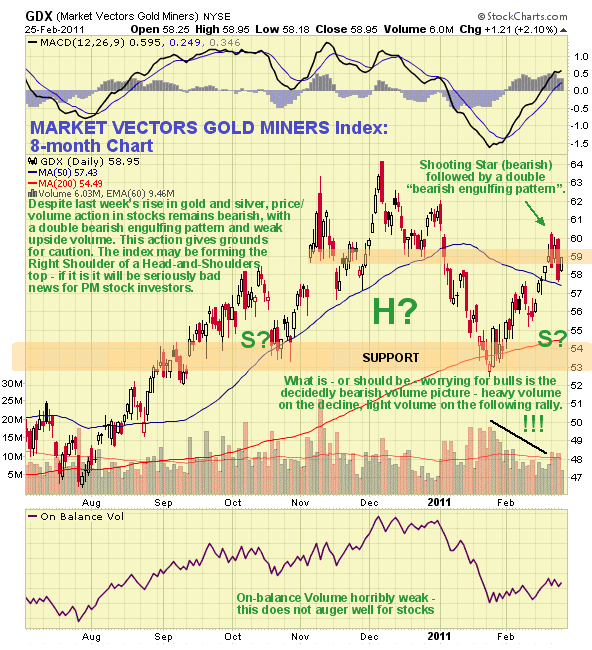
A worrying background influence for gold and silver bulls is the continuing marked weakness in the PM stock index charts. They barely made any progress at all last week on gold's breakout and silver's continued rally, and bearish price/volume action continued. On the 8-month chart for the Market Vectors Gold Miners Index we can see that the bearish "shooting star" candlestick that we observed in the last update has been followed by a pair of "bearish engulfing patterns" both of which were characterized by higher volume on the down days, and the continuing abysmally weak volume pattern has resulted in a sick looking On-balance Volume line - it would thus appear that astute traders have been dumping onto this rally. As pointed out before there is thus the danger that the latest rally in the PM stock indices constitutes the Right Shoulder of a Head-and-Shoulders top. This is definitely not what the doctor ordered and the contradiction between the seemingly bullish gold chart and the frail looking PM stock index charts is stark and something we would be unwise to ignore. The large stock XAU index looks horribly weak and like it is now completing a bearmarket rally, also the potential Right Shoulder of a Head-and-Shoulders top. This is the reason that we dumped some of our PM stocks for a good profit over the past week or two as they rose to hit resistance.
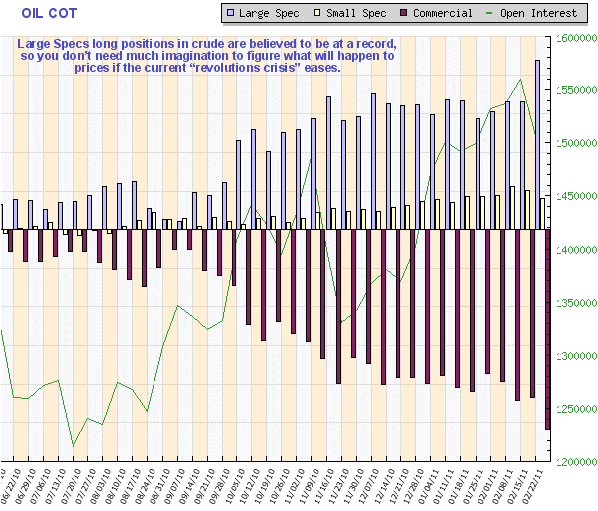
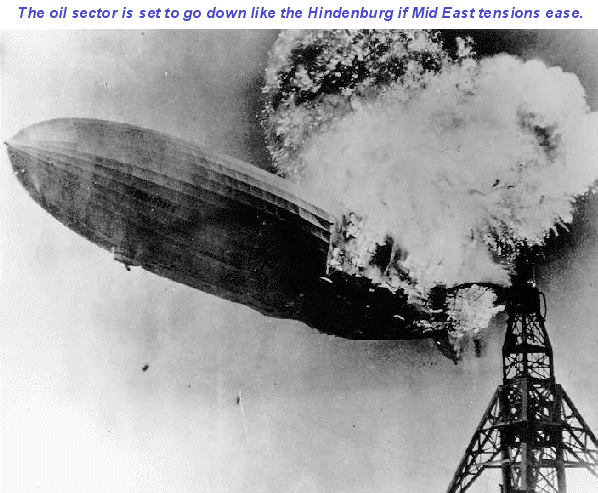
Fundamentally of course much depends on whether the "Mexican Wave" of revolutions in the arab world continues and engulfs big important countries like Saudi Arabia and Iran. Oil prices spiked last week on fears of a worst case scenario, but the fact that the Rydex Funds, who perform very well as a contrary indicator, have ramped up their holdings in the energy sector close to the levels they were at just before the 2008 crash, and that Large Spec long positions in oil as revealed by the latest COT charts have risen to what is believed to be record levels, suggests that if the "revolutions crisis" in the arab world starts to ease, the oil sector could go down like the Hindenburg. In this situation gold and silver could also suffer from an easing of the fear factor which is largely what generated last week's gains.
By Clive Maund
CliveMaund.com
For billing & subscription questions: subscriptions@clivemaund.com
© 2011 Clive Maund - The above represents the opinion and analysis of Mr. Maund, based on data available to him, at the time of writing. Mr. Maunds opinions are his own, and are not a recommendation or an offer to buy or sell securities. No responsibility can be accepted for losses that may result as a consequence of trading on the basis of this analysis.
Mr. Maund is an independent analyst who receives no compensation of any kind from any groups, individuals or corporations mentioned in his reports. As trading and investing in any financial markets may involve serious risk of loss, Mr. Maund recommends that you consult with a qualified investment advisor, one licensed by appropriate regulatory agencies in your legal jurisdiction and do your own due diligence and research when making any kind of a transaction with financial ramifications.
Clive Maund Archive |
© 2005-2022 http://www.MarketOracle.co.uk - The Market Oracle is a FREE Daily Financial Markets Analysis & Forecasting online publication.