


Caught: Krugman's Shifting Arguments
Economics / Economic Theory Mar 03, 2011 - 12:04 PM GMTBy: Robert_Murphy

 It's not newsworthy when Paul Krugman contradicts himself. However, in two recent blog posts on the varying economic fortunes of US states, Krugman's about-face was so complete and so fast that I just have to share.
 Krugman's Kind of Contradiction
At the outset I should note that Paul Krugman is a very clever, careful guy. It's extremely rare when I think I catch him actually citing an objective number that is demonstrably wrong. Instead, the typical way Krugman contradicts himself is that he'll make a judgment call of interpretation that goes one way when it helps his Keynesian position, but then in another situation he'll make that same judgment call a different way, again to reinforce his overall worldview.
If the reader isn't a regular reader of Krugman, he or she might not know what I mean. Fortunately, this latest example epitomizes the pattern.
Krugman, Take 1: Different Unemployment Rates among the States Are an Illusion
Back on February 10, Gillian Tett had a piece in the Financial Times warning investors that it was no longer the case that "municipal bonds" were a homogeneous asset class. Instead, Tett argued that there was a growing "divergence" among member states of the United States, in the same way eurozone members (e.g., Germany and Ireland) had economies in much different conditions.
Krugman didn't like this analogy, and the next day gently chided Tett this way:
I'm a big fan of Gillian Tett's work, but … in today's piece she falls prey to a map trick. She looks at the divergence in unemployment rates among US states, and suggests that America is experiencing European-style divergence. … [I]t's true that if you look at a map, it seems as if there are large regions with low unemployment:
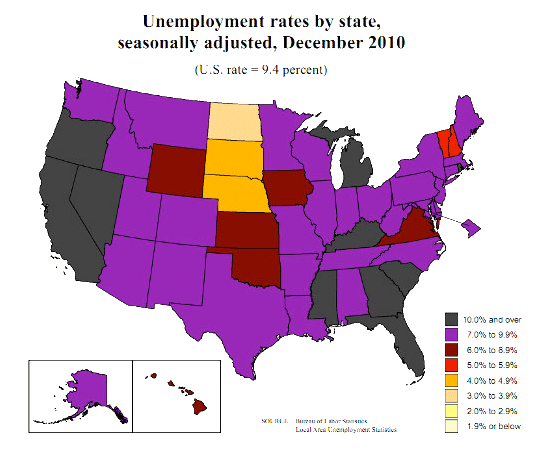
Hold the phone for a minute. Before continuing, let's just pause to marvel at whatever point Krugman is about to make. Look at what he's saying: Yes, if you look at a map showing unemployment rates by state, then you might conclude that there are vast differences among the economies at the state level. So hold on to your hat, because now Krugman is going to tell us why looking at a map of unemployment rates is not the right way to figure out if different regions are experiencing different unemployment rates:
But nobody lives there: the Dakotas and Nebraska combined have only 3.3 million people, around 1 percent of the US total.
What you really want to do is compare large US states with large European nations. And there aren't any low-unemployment large states. Yes, there's a divergence: New York and Texas have unemployment rates of 8.2 and 8.3 percent, respectively, while California's rate is 12.5. But that's nothing like the divergence between Germany, with a 6.6 rate, and Spain, with a 20.2 rate.
For the most part, all of America is sharing in this slump.
This is crucial, so let's make sure we understand Krugman's point. He is saying that it's an "illusion" (that word is in the title of his blog post: "Area Illusion") to think there are significant differences among the US states in terms of unemployment. Now be careful, Krugman tells us, because "if you look at a map" you might get the wrong impression, because the state-level unemployment numbers differ so widely. (That was Tett's whole point for investors in municipal bonds.)
The reason the above map is misleading, according to Krugman, is that the states with low unemployment have low populations. For the economist who has a sense of judgment, "all of America is sharing in this slump."
Now if you think that this is a bogus argument, don't bother trying to put your finger on why. Krugman himself will completely reverse his position in a mere 14 days later.
Krugman, Take 2: Different Unemployment Rates among the States Prove That Obama Stimulus Worked
As we just demonstrated, on February 11 Krugman stated quite clearly that there was no real difference among the US states in terms of economic health, and that any such apparent difference was an illusion driven by the small-population states.
That is why it was so interesting to me when I read Krugman's blog post on February 25, in which he lavished praise on a new study from two Dartmouth professors allegedly showing that the Obama stimulus package created more jobs than its proponents initially thought:
Dean Baker points us to Feyrer and Sacerdote, who use cross-state variation in stimulus spending per capita to estimate the employment effects of the stimulus. They find a clear positive effect: states that got more money per person did better on jobs. And as Baker points out, the national effects must have been larger, since some money spent in New Jersey presumably creates jobs in New York and vice versa.
Now already, Krugman has problems. Back on February 11, he told us that when it comes to unemployment, "all of America is sharing in this slump." So it's a bit weird that two weeks later he points to the different levels of employment among the states as evidence that the stimulus was effective.
But wait, it gets even better. Let's look at the main driver of this result, according to Krugman:
Anyway, there's something else that's interesting about the Feyrer-Sacerdote paper. In doing their analysis, they looked for "instruments" on stimulus spending. Instrumental variables is a statistical technique that you use to avoid having your results contaminated by reverse causation — say, if stimulus funds were directed to states with especially severe unemployment problems, you might find a spurious negative correlation between stimulus and unemployment. What you need to get around this is some variable that is correlated with stimulus but not affected by the job changes; in effect, you use this other variable to create a predicted stimulus level, then look at how employment is affected by the predicted level, not the actual level. If I've just lost you, never mind.
The point is that the best instrument Feyrer-Sacerdote found was population: low population states got a lot more stimulus per capita. As they say, this could be because they have a lot of roads per capita, or it could be because they're rotten boroughs, with two senators even if they have no people.
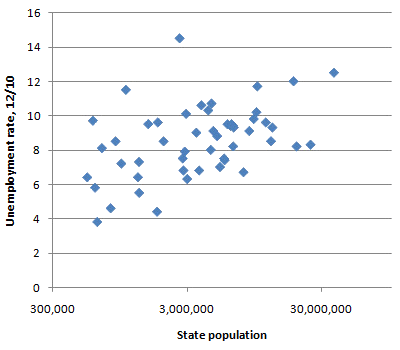
This set me rolling my own scatterplot. Here's state population versus the unemployment rate in December 2010:
Yep: small states in general had low unemployment. Not all, of course — there's Nevada. But the correlation is clear.
I really hope the reader sees the beauty of it all. When Gillian Tett innocently pointed out that there were divergent levels of employment among the US states, Krugman told her it was an "illusion." He said that a big difference in unemployment rates between two states was meaningless, if one of the states was big and the other small.
But a mere two weeks later, when two professors come along with a paper arguing that the low unemployment in small states is evidence for the effectiveness of stimulus spending, Krugman finds it very compelling and a clever technique to boot.
Now Krugman is a sharp guy. Somewhere in the back of his mind he must have had a vague sense of uneasiness, because it seemed he was flatly contradicting (in the Krugman way of course) his position from two weeks earlier. So this is how he ended the second blog post:
And this has an interesting implication. If Feyrer and Sacerdote are right, people in the Dakotas, Nebraska and so on are congratulating themselves on their good employment performance, a result of their rock-ribbed self-reliance — when what actually happened is that they got themselves an outsized share of the very stimulus they denounce.
Ah, well-played Dr. Krugman. Take your contradiction and spin it around. No longer are the rubes in Nebraska wrong for even taking their unemployment number seriously — I mean really, is there even a decent mall in Nebraska? — but now they're wrong for citing their (completely meaningful) unemployment number as proof of the power of small government.
Reading Krugman's Mind
As I mentioned upfront, Krugman rarely engages in a literal contradiction. Even in this case — which I consider to be a smoking gun — I'm sure his defenders will say something like this, "There's no contradiction here, Murphy. Krugman is consistently saying that (a) there isn't a big difference among unemployment among the states, but (b) if you do look at the differences, you can explain a lot of the variation by per capita stimulus spending."
I can't prove that this reconciliation is false, but I have my own theory. I think Krugman initially wanted to kill the idea that there are differences among the states, because once you go down that path you start trying to figure out why (say) the left-liberal bastions of Michigan and California are doing so terribly, whereas the more conservative states priding themselves on "rock-ribbed self-reliance" are doing much better. I think Krugman, perhaps subconsciously, wanted to nip that in the bud. (Perhaps he is also still smarting from the dustup over the bursting of the housing bubble and unemployment among the states.)
However, once it looked like the variation in unemployment rates among the states could be used for the Keynesian position, now all of sudden these are very significant data indeed! No more "illusion"; now this is the smoking gun of multiplier analysis.
Before closing, there's one other interesting tidbit: Remember in that first blog post, Krugman said that if you want to get a sense of a true contrast in economic growth, you shouldn't be looking at US states. Instead, you should look at Germany versus Spain, with unemployment rates of 6.6 percent and 20.2 percent, respectively.
Fair enough, Professor Krugman, let's consider those two countries. Now between Germany and Spain, which country had a 3.3 percent budget deficit in 2010, and which had a deficit more than 9 percent? And if that is construed as reversing causation and correlation, let's ask more generally, Which country has a reputation as being austere and tightfisted, and which country was President Obama's role model for government "green-jobs" investment?
Conclusion
One of the biggest problems in the social sciences is that we can't run controlled experiments. That's why Keynesians and Austrians can cling to such vastly different policy conclusions, despite decades of experience and mounds of data. Just because unemployment "unexpectedly" shot way up after passage of the Obama stimulus package, doesn't mean it was a bad idea. The Keynesians are right: it's possible that unemployment would have been even worse in the absence of massive deficit spending. This is why it's so important to have sound theoretical views, which we then use to sift the data and make sense of things.
Paul Krugman's recent blog posts on state-level unemployment show just how easy it is for economists to protect their views from counterevidence. There are always arguments floating about that can take empirical evidence that was initially a liability and flip it around into a strength.
Robert Murphy, an adjunct scholar of the Mises Institute and a faculty member of the Mises University, runs the blog Free Advice and is the author of The Politically Incorrect Guide to Capitalism, the Study Guide to Man, Economy, and State with Power and Market, the Human Action Study Guide, and The Politically Incorrect Guide to the Great Depression and the New Deal. Send him mail. See Robert P. Murphy's article archives. Comment on the blog.![]()
© 2011 Copyright Ludwig von Mises - All Rights Reserved Disclaimer: The above is a matter of opinion provided for general information purposes only and is not intended as investment advice. Information and analysis above are derived from sources and utilising methods believed to be reliable, but we cannot accept responsibility for any losses you may incur as a result of this analysis. Individuals should consult with their personal financial advisors.
© 2005-2022 http://www.MarketOracle.co.uk - The Market Oracle is a FREE Daily Financial Markets Analysis & Forecasting online publication.