


Dow Theory with Hurst Cycles
Stock-Markets / Stock Markets 2011 Mar 07, 2011 - 04:18 AM GMTBy: readtheticker

 The Dow Theory has two components the Dow Jones Industrials index and the Dow Jones Transports index. The basis of this theory is based on pure technical analysis of the two indexes. The Dow Transports is the more volatile of the two, and what the reader may not know contains a technical statistic that is at the very least 85% accurate.
But first, Dow Theory 101 from wikipedia.
Developer: Charles H Dow (1851-1902)
Tenets of Dow Theory tenets
1)Stock market trends have three phases: Accumulation, Public participation, distribution.
2)Stock market discounts all news.
3)Stock market indexes must confirm each other.
4)Trends of indexes must be confirmed by volume.
5)Trends exist until definitive signals prove that they have ended.
If you are a reader of Richard Wyckoff then you will notice the comparison.
Moving on.. Here is why the Dow Theory works. Sector rotation represents business activity.
…”In Dow's time, the US was a growing industrial power. The US had population centers but factories were scattered throughout the country. Factories had to ship their goods to market, usually by rail. To Dow, a bull market in industrials (INDU) could not occur unless the railway average rallied as well (TRAN), usually first. According to this logic, if manufacturers' profits are rising, it follows that they are producing more. If they produce more, then they have to ship more goods to consumers. Hence, if an investor is looking for signs of health in manufacturers, he or she should look at the performance of the companies that ship the output of them to market, the railroads. The two averages should be moving in the same direction. When the performance of the averages diverge, it is a warning that change is in the air.”..
Sure a lot has changed since 1902, and so have the components of the respective indexes, the industrial and transport index reflect globalisation and the all the modern modes transportation. The Dow Theory still demands respect, and the modern day results prove it with an 11.89% compound annual return (See results here: www.thedowtheory.com).
I now have your mind primed with a solid history and understanding of the Dow Theory, and you should also understand from the above that the leading indicator for Dow Theory is the Dow Jones Transports index. In other words, analysis of the transports index will give you a heads up of future market turns of the more senior Dow Jones Industrial index.
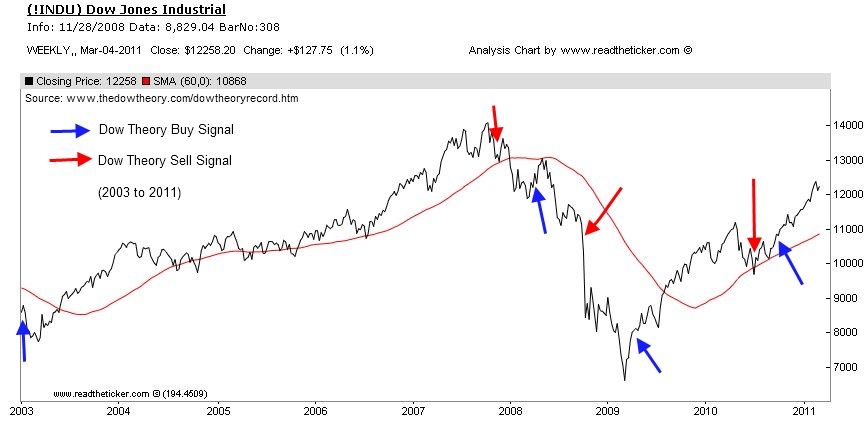
Let review the Dow Theory Signal since 2003 on a weekly Dow Jones Industrial chart (INDU).
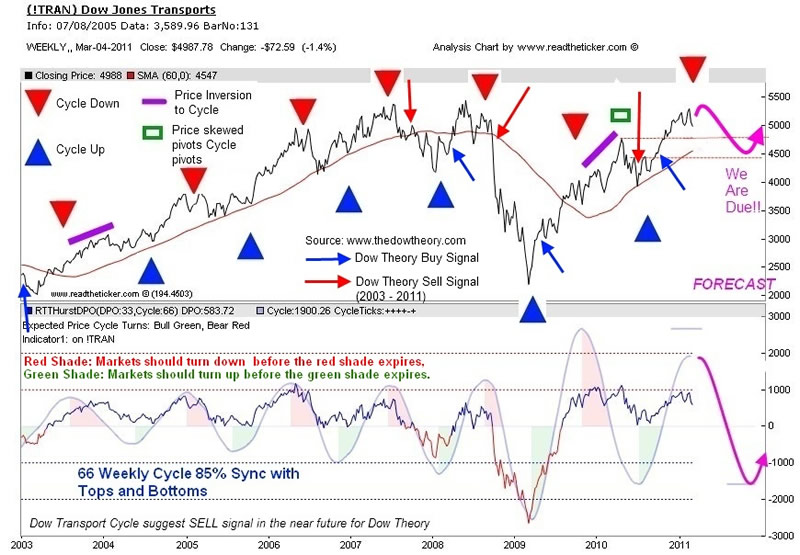
As stated above the Dow Jones Transports (TRAN) is a leading and confirming index of the Dow Jones Industrials. We completed our cycle scans with the RTT Cycle Finder Spectrum and we found a dominant weekly cycle of 66 weeks for the TRAN. (To understand Hurst cycles 101 please review our website). For the 66 weekly cycle to maintain is dominance price action must conform to the cycle peaks and troughs. We use our RTTHurstDPO to measure the conformity, in short price must move down at least half way to the cycle trough before the red shade has expired, and then move back up at least half way to the cycle peak before the green shade has expired. Any failure to do my mean a price inversion to the cycle may be occurring.
The following chart shows a very accurate cycle relationship to price, with only two price inversions. (The math: 11 out 13 correct calls = 85% accuracy). Not all cycle swings resulted in Dow Theory sell or buy signals, but all Dow Theory signals were preceded by a cycle swing and it was a question of significance if a Dow Theory signal was generated or not. Currently we have a Hurst Cycle peak and I would expect the TRAN to roll over at a minimum to the 60 week simple moving average (red line) or about 12.5% correction. As I write this oil is the bearish catalyst. Prices are skyrocketing and this bodes ill winds for the US and world economies. Will a roll over in the TRAN be accompanied by the Dow Jones Industrials (INDU) significant enough to force a Dow Theory sell signal only time will tell? You can thank, the 66 week cycle (with its 85% accuracy) on the TRAN for the heads up.
Of course if you’re not bothered with Dow Theory signals, trading the TRAN all on its own will produce better returns than most systems when you have the power of the dominant Hurst cycles on your side. Looks like 'Sell in May' may be late this year !
Readtheticker
My website: www.readtheticker.com
My blog: http://www.readtheticker.com/Pages/Blog1.aspx
We are financial market enthusiast using methods expressed by the Gann, Hurst and Wyckoff with a few of our own proprietary tools. Readtheticker.com provides online stock and index charts with commentary. We are not brokers, bankers, financial planners, hedge fund traders or investment advisors, we are private investors
© 2011 Copyright readtheticker - All Rights Reserved
Disclaimer: The material is presented for educational purposes only and may contain errors or omissions and are subject to change without notice. Readtheticker.com (or 'RTT') members and or associates are NOT responsible for any actions you may take on any comments, advice,annotations or advertisement presented in this content. This material is not presented to be a recommendation to buy or sell any financial instrument (including but not limited to stocks, forex, options, bonds or futures, on any exchange in the world) or as 'investment advice'. Readtheticker.com members may have a position in any company or security mentioned herein.
© 2005-2022 http://www.MarketOracle.co.uk - The Market Oracle is a FREE Daily Financial Markets Analysis & Forecasting online publication.