


Dow Jones Stock Market Index Gives On Balance Volume Sell Signal
Stock-Markets / US Stock Markets Nov 16, 2007 - 12:25 AM GMTBy: Brian_Bloom

 November 19th 2007 - Revisited : The chart below is a close-up of the Dow Jones Industrial Index as at close of business in the USA on November 15th 2007 (courtesy bigcharts.com )
This looks suspiciously like an OBV sell signal to me. The primary argument of the protagonists of On-Balance-Volume (invented by Joseph Granville) is that ‘volume precedes price'. Therefore, an OBV sell signal should precede a decline in stock prices and we should expect a sell signal in price.
There is a theory called Dow Theory which has two components.
Dow Theory argues that if:
- Underlying values are absent (as defined by dividend yields being less than 3%); and
- Both the Industrial shares and the Transports fall to lower lows
Then: a Primary Bear Trend will likely begin to emerge
The current yield on the Dow Jones Industrial Index is 2.3% (Source: http://www.decisionpoint.com /prime/dailycharts/mktsummEARN .html )
Mr Richard Russell is the world's leading protagonist of Dow Theory. He has recently pointed out that, because the Transportation Index has already fallen to lower lows, any fall of the Dow Industrials to a level below 12,845.78 this will represent a new low for the Dow, and this will confirm a Dow Theory Sell Signal.
I agree with him.
Having said this, the signals are not as cut and dried as they could be, because the chart below is showing a “buy” signal
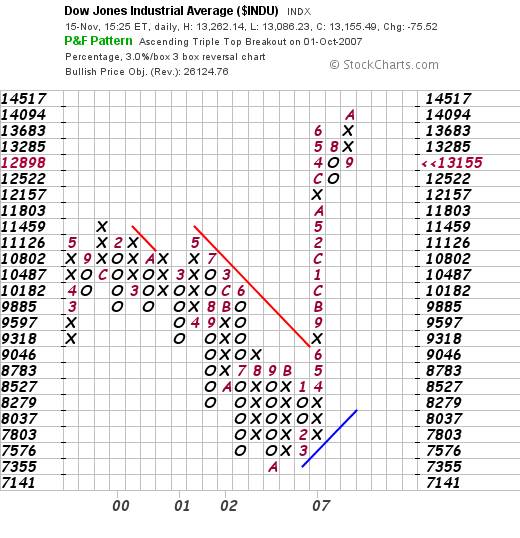
The DJIA would need to fall to the 12,522 level for the above chart to signal a “High Pole” sell signal.
If such a signal were to be given, then the price can be expected to have some support at the halfway mark which, if that level is broken, will likely lead to a price destination of 8,783 before the market finally makes up its mind whether to “fight” or “throw in the towel”
From where I am sitting there are two potential catalysts to a sell signal:
- Mr Jim Sinclair of jsmineset.com has recently alerted his readers to the fact that new bank reporting procedures will kick in, in the USA from tomorrow ( November 16 th 2007 ). The rules are that various categories of assets now need to be defined and “marked to market”, and Mr Sinclair has argued that “Category 3 Assets” may be described as "Bat Guano Asset Category". His reasoning sounds objective to me and an implication is that the banks will likely take heavier knocks to their profits than heretofore. The OBV sell signal may be pointing to bad news tomorrow.
- The political infrastructure of the world is highly unstable, and there are any one of half a dozen countries where some sort of “crisis” may manifest which, if it does, will be sufficient to deal a death blow to investor confidence this time around
What will this do to gold?
In my view, gold will never be a “currency” in the strict sense of the word – wherein it is used in payment of day-to-day transactions. The practical realities preclude this from happening
Historically, it has been a commodity which acts as a store of value relative to other assets.
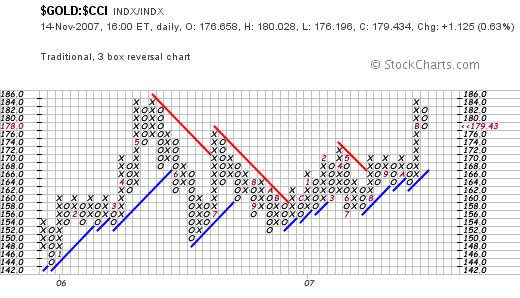
The chart below shows the ratio of gold to the $CCI Commodities index, and a “double top” can be seen. Gold failed to break up relative commodities and is still behaving like a commodity. (Courtesy stockcharts.com )
What of the future? Will gold ever become the world “medium of exchange” where the value of money is benchmarked against gold?
That is theoretically possible, but an implication is that, unless the volume of gold held in Central Banks keeps pace with world population growth, “money per capita” must fall. For the economy to keep growing under such circumstances implies that “velocity of money” needs to accelerate. The alternative would be for the face value of gold to rise in price as more certificates are issued to compensate for growing population – and that will put us back into a monetary inflation spiral, which is where we are now. The issue has never been a Gold Standard vs Fiat Currencies. This issue has always been the fundamentally dishonest manner in which the Central Bankers have been managing the economy. If you are going to put a fox in charge of the henhouse, your chickens will disappear. It doesn't matter how secure a lock you put on the gate if the fox has the keys.
But there is a wild card.
Gold as a commodity is extremely valuable, and that value has not yet become generally recognised. Gold as a commodity offers technological advancement opportunities of enormous significance. In the long term, gold is worthy of investment through thick and thin because:
- It is an indestructible store of value
- It has some extraordinary (and unique) physical properties which transcend its indestructibility.
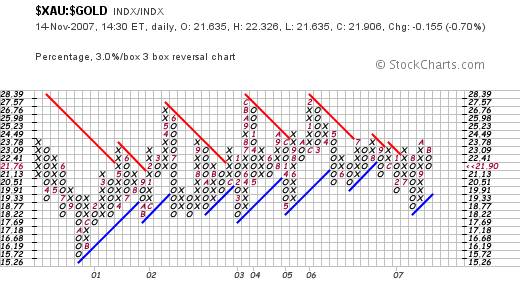
Right now, the chart below shows that the gold price has a long term target of $1,403.93
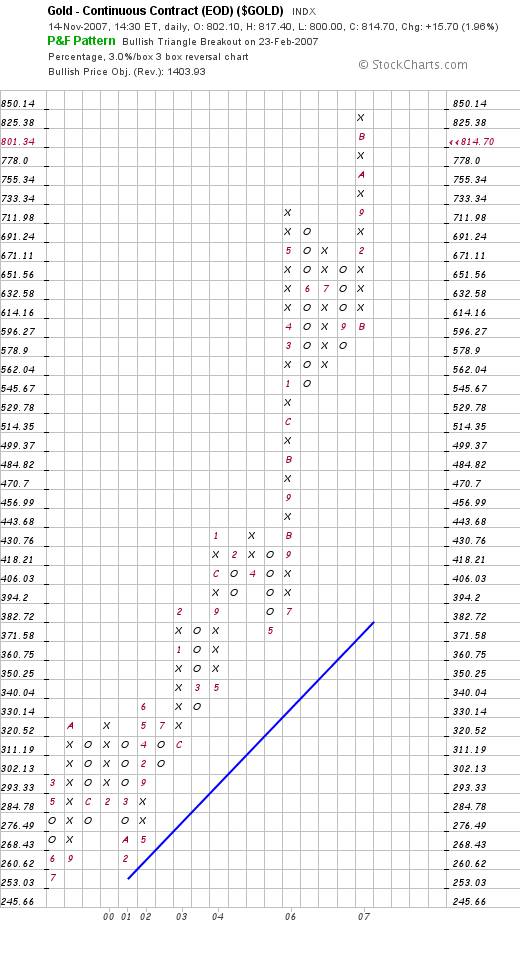
At this point, there is no reason to disbelieve what this chart is telling us. And one should also bear in mind that in the field of marketing “perception is reality”. I may personally be convinced that gold will never become a currency, but there is a growing number of people who disagree with me, because they perceive gold to be the currency of last resort. If enough people have this perception, it becomes a reality, regardless of what one analyst may think. It's for that reason I pay so much attention to the charts. They reflect investor perceptions; regardless of underlying fundamentals. (But we should never lose sight of the fact that fashions come and go. The reality is that fundamentals dictate share prices when perceptions and dreams fade.)
Finally, what should we expect of gold share prices in the event that the Industrials tank?
The chart below (courtesy stockcharts.com ) shows that gold shares have been tracking the price of gold within a fairly narrow band.
Given the “leverage” that gold shares represent, if gold is in a Primary Bull Market and headed for new highs, or if Gold is in a Primary Bear Market and headed for new lows, then the gold shares should either outperform or under-perform gold as the case may be.
For the past few years, the shares have been roughly tracking the gold price and the primary reason for this has been that as the gold price in dollars has been rising the US dollar has been falling.
But there is one very important issue on which one needs to focus if the Dow Jones Industrials tank:
This will almost certainly lead to a credit crunch. Under these circumstances, undercapitalised gold mines may find it very difficult to raise capital.
When all is said and done, from a US investor's perspective, all the above means that “safety” is paramount – and the chart below shows that there has been a flight to safety as money has been pouring into Treasury Bonds
The ten year bond yield (chart courtesy stockcharts.com ) has just given a sell signal (which implies a buy signal at capital value level)
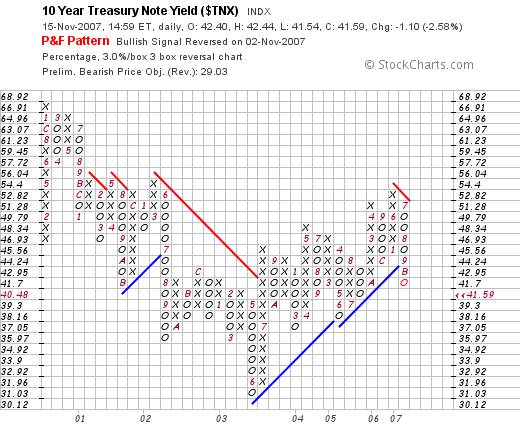
Unfortunately, if yields are falling within the USA (and are rising outside the USA ) then there will be flight of capital from the USA which, in turn, will cause the US Dollar to come under further pressure
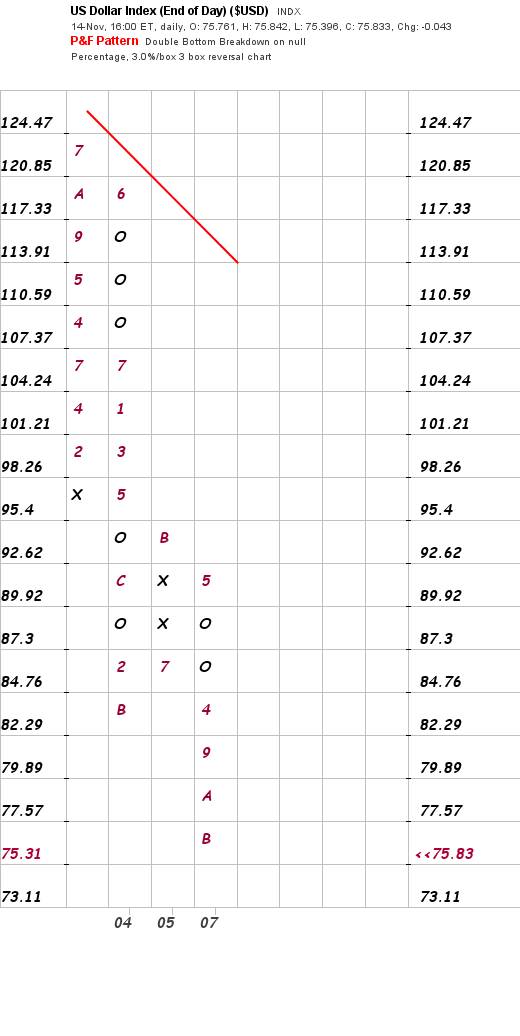
The above chart is unable to be read in terms of “signals”. The US Dollar is in the wilderness, where it will roam until the world's leaders finally focus on the importance of “ethics”.
Right now, our problems flow from the fact that the ethical fabric of society has been all but ripped asunder. Without a robust ethical safety-net, society will disintegrate to become rabble.
Conclusion:
The article I wrote (tongue in cheek) on June 10 th 2004 may have been too accurate for comfort. http://www.gold-eagle.com /editorials_04/bloom060904.html
November 19th 2007 may turn out to be a watershed day.
Cheers
By Brian Bloom
www.beyondneanderthal.com
Since 1987, when Brian Bloom became involved in the Venture Capital Industry, he has been constantly on the lookout for alternative energy technologies to replace fossil fuels. He has recently completed the manuscript of a novel entitled Beyond Neanderthal which he is targeting to publish within six to nine months.
Author's comment - It appears that the authorities have not yet come to understand the subtleties and/or the nuances of the statement that “energy drives the world economy”. An unholy alliance between the Banking Industry, the Fossil Fuel Industries, Big Business and the Politicians has given rise to a life-threatening accident that is now waiting to happen.
The time has come for the world to begin migrating to a new platform of industrial, consumer and transport technologies which will be driven by electromagnetic energy. There are three such energy technologies which are introduced in my novel, Beyond Neanderthal , which is targeted for publication in March 2008. The logic which underpins these technologies is compelling. If embraced, they have the capacity to usher in a new era of human evolution.
By means of its entertaining storyline, Beyond Neanderthal explains both the logic and the technologies themselves, and also articulates a clear pathway forward. If taken, this pathway will enable us to extricate ourselves from the quagmire into which we have been led by the unholy alliance of self-interested groups. There is still a window of opportunity to act – but the evidence suggests that this window will begin to close around 2012. Please register your interest to acquire a copy of the novel at www.beyondneanderthal.com .
Brian Bloom Archive |
© 2005-2022 http://www.MarketOracle.co.uk - The Market Oracle is a FREE Daily Financial Markets Analysis & Forecasting online publication.