


Silver Bull Market Continues
Commodities / Gold and Silver 2011 May 03, 2011 - 01:04 AM GMTBy: Tony_Caldaro

 For the past few years we have received constant requests to provide a report on Silver. We have provided numerous reports on Gold since we feel it is money, not currency, and it has been in a bull market since 2001. Silver, on the other hand, is currency. Not fiat currency that can be mass produced with a printing press or, nowadays, just a keystroke on a FED computer. Silver has always been a means of exchange for one tangible asset or another, until the past several decades. Whether anyone still considers Silver a currency in not important. What is important is that it has been in a secular bull market since 1993, and a recent bull market since 2008. The following chart displays this secular bull market.
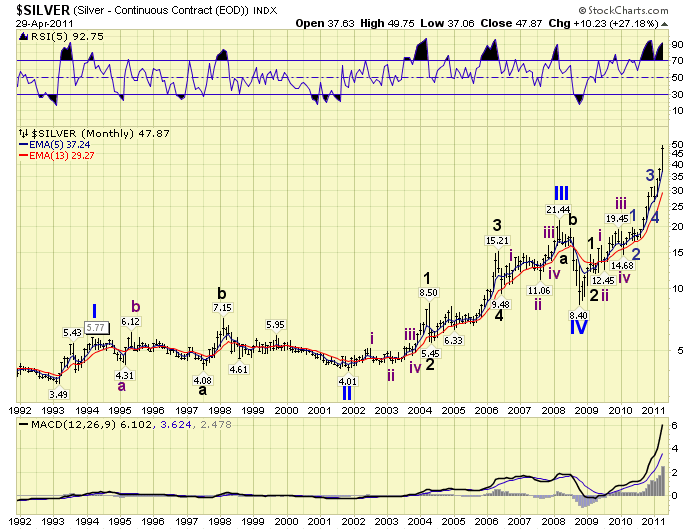
After the $48.00 peak in 1980 Silver entered a secular bear market along with Gold. The commodity bull market had ended. While Gold did not bottom until 2001 Silver made its actual price low in 1993 at $3.49/oz. After a Primary wave I rally to $5.77 in 1994 Silver went into a prolonged irregular Primary wave II bear market bottoming at $4.01 in 2001 with Gold. After the bull market in Gold kicked in, Silver finally started impulsing again to the upside. In 2008 it hit a Primary wave III top at $21.44, but then lost over 60% of its value in the mass liquidation of 2008. When it hit a low of $8.40 it ended Primary wave IV and embarked on the always parabolic Primary wave V.
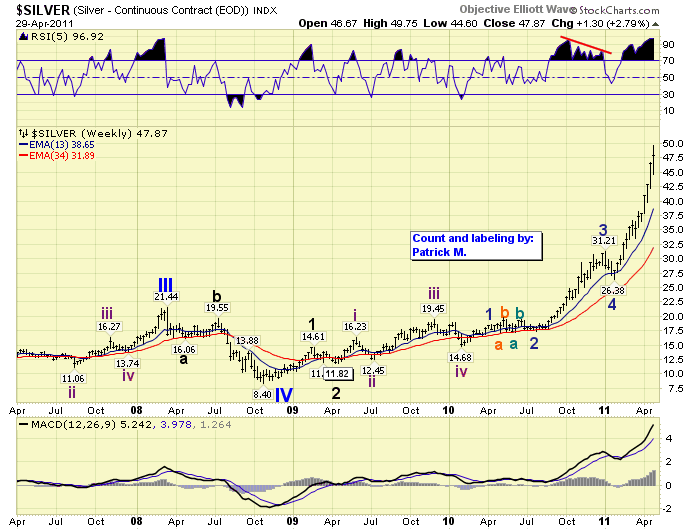
The weekly chart displays our OEW count heading into the Primary wave III top, the Primary wave IV low, and the current Primary wave V. Elliott Wave purists should not be alarmed. Silver, like many commodities, sometimes overlaps waves in impulsing bull markets. This is a characteristc of a regular 24 hour futures market. This is also one of the reasons it is difficult to count clean stock market impulse waves using the futures contracts.
Primary wave V is dividing into five Major waves. The first Major wave was quite simple. It uptrended from the 2008 Primary wave IV low at $8.40 to $14.61 in early 2009. Major wave 2 was quite short and corrected to $11.82. Then Silver entered an extended subdividing Major wave 3. Major waves, in bull markets, divide into five Intermediate waves. The first four of these Intermediate waves were simple: $16.23, $12.45, $19.45 and $14.68. When Silver entered Intermediate wave five it immediately started to subdivide into Minor, Minute and Micro waves. A dynamic Intermediate wave five was about to unfold.
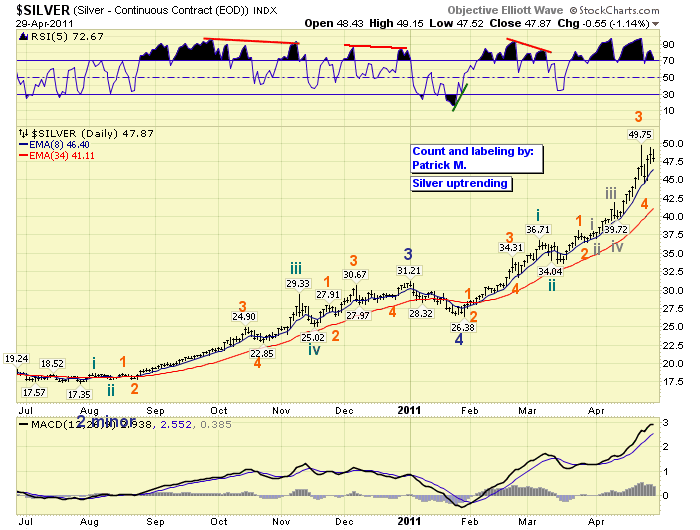
This daily chart displays the market action since the complex Minor wave 2 low at $17.35 in July 2010. Notice the strength and subdivisons of Minor wave 3. After it topped im Jan11 at $31.21 a simple zigzag correction followed, alternation, bottoming also in Jan11 and at $26.38. The current uptrend, Minor wave 5, is subdividing even further. Fifth waves are usually the most dynamic for commodities in general, but especially for the precious metals. When this uptrend ends, so will Minor wave 5, Intermediate wave five, and Major wave 3. Then we should observe a very sharp correction, likely a zigzag, to alternate with the Major wave 2 flat.
When we apply fibonacci analysis to the current wave structure we arrive at two potential upside targets for Major wave 3. The first target is in between $51.60 and $54.40. Calculations: @ $51.60 Minor 5 = 6.85 Minor 1, @ $53.20 Minor 5 = 1.618 Minor waves 1 thru 3, and @ $54.40 Major 3 equals 6.85 Major 1. The second target is in between $62.60 and $66.90. Calculations: @ $62.60 Int. 5 = 6.85 Int. 3, @ $62.70 Minor 5 = 2.62 Minor 3, and @ $66.90 Int. 5 = 6.85 Int. waves 1 thru 3. There you have it: first target $52 – $54 and second $63 – $67.
Looking further out into the potential 2014 bull market top we made some Fibonacci calculations for the bull market high. Once Major wave 3 and Major wave 4 conclude we should be able to fine tune these calculations. The calculations: @ $82.10 Primary V equal 4.23 Primary III, @ $84.30 Primary V equals 4.23 Primary waves I thru III, @ $127.80 Primary V equals 6.85 Primary III, and @ $131.40 Primary V equals 6.85 Primary waves I thru III. These calculations suggest a bull market high between $82 – $84 or $128 – $131. If you would like to track Silver along with us please scroll down the page of this link:
CHARTS: http://stockcharts.com/...
http://caldaroew.spaces.live.com
After about 40 years of investing in the markets one learns that the markets are constantly changing, not only in price, but in what drives the markets. In the 1960s, the Nifty Fifty were the leaders of the stock market. In the 1970s, stock selection using Technical Analysis was important, as the market stayed with a trading range for the entire decade. In the 1980s, the market finally broke out of it doldrums, as the DOW broke through 1100 in 1982, and launched the greatest bull market on record.
Sharing is an important aspect of a life. Over 100 people have joined our group, from all walks of life, covering twenty three countries across the globe. It's been the most fun I have ever had in the market. Sharing uncommon knowledge, with investors. In hope of aiding them in finding their financial independence.
Copyright © 2011 Tony Caldaro - All Rights Reserved Disclaimer: The above is a matter of opinion provided for general information purposes only and is not intended as investment advice. Information and analysis above are derived from sources and utilising methods believed to be reliable, but we cannot accept responsibility for any losses you may incur as a result of this analysis. Individuals should consult with their personal financial advisors.
© 2005-2022 http://www.MarketOracle.co.uk - The Market Oracle is a FREE Daily Financial Markets Analysis & Forecasting online publication.