


Stock Market Correction Since October Appears to be Ending
Stock-Markets / Cycles Analysis Nov 19, 2007 - 01:16 PM GMTBy: Andre_Gratian

 Current Position of the Market
SPX: Long-Term Trend - The 12-yr cycle is nearing its mid-point and some of its dominant components may already be restraining the bullish effect of the 4.5-yr cycle. 2008 should see a period of intermediate term consolidation into the late summer or Fall, followed by an eventual bull market top in 2009-2010.
SPX: Intermediate Trend - The correction to the intermediate-term trend which has been ongoing since 10/11 appears to be in the process of ending.
Analysis of the short-term trend is done on a daily basis with the help of hourly charts. It is an important adjunct to the analysis of daily and weekly charts which determines the course of longer market trends .
Daily market analysis of the short term trend is reserved for subscribers. If you would like to sign up for a FREE 4-week trial period of daily comments, please let me know at ajg@cybertrails.com .
Overview
I started last week's newsletter with the following: The early part of next week will be very important in assessing the nature of this decline. This is when the cycles which are behind the correction are expected to make their lows, but the degree of weakness which remains will also be a clue in determining whether or not this was only a corrective move, or the beginning of something bigger.
We now know that it was "something bigger" which quickly plunged the SPX 50 points lower and caused many investors to think that a bear market had started. Perhaps it has, but I doubt it for the various reasons that will be given in the following segments. This correction was expected and forecasted in my 10/7 Weekend Report. The SPX top of 1576 came a few points shy of the 1585 projection, and a few days short of the stated 10/17 date. But there are signs that it may be just about over. As you will see, positive divergences are beginning to appear in daily momentum and A/D indicators. Also, last week the index just about reached its most likely downward projection of 1437, followed by a strong rebound and a re-test of the low.
It is possible, as we will see under " Cycles ", that the correction could continue until mid-December. By that time, the SPX may or may not have made a new low, depending on the corrective pattern which the index is currently making.
We discussed in the last newsletter that a market segment which has been primarily responsible for the decline in the big caps, was the financial sector. The Banking index took a big hit as a result of the sub-prime mortgage problem and since it is responsible for about 20% of the SPX components, it is no wonder that it took the SPX down with it. But now, the BKX appears to be making at least an intermediate-term bottom. After a good initial rally last week it came right back down in an apparent test of its recent lows.
What's Ahead?
Momentum:
The following daily charts of the SPX are meant to show why it is likely than we are in the process of making a short-term low prior to resuming the uptrend. Let's start by analyzing the top one.
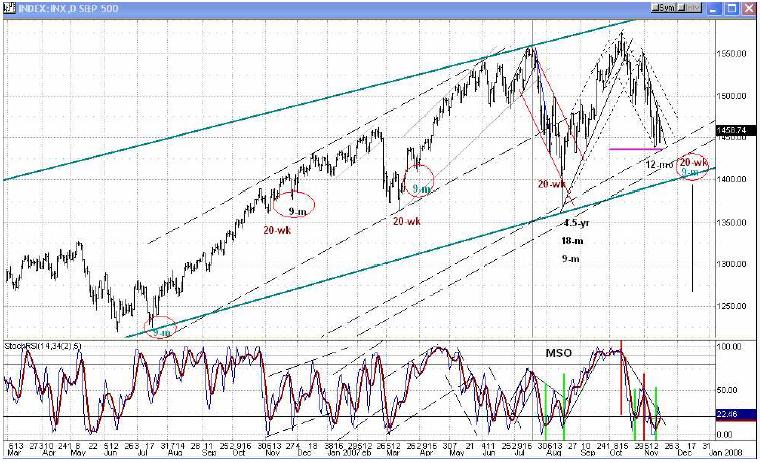
The heavy green lines represent the long term channel of the SPX going back to 2002. There are also some parallel dashed lines. Both should act as support for the SPX should it attempt to go lower.
The index is trying to make a base in the vicinity of the most valid projection target from the top (pink line), a level which was determined by two separate Fibonacci measurements.
The momentum index at the bottom of the chart has already made two trips to the low of its range, is still oversold, and is beginning to show positive divergence.
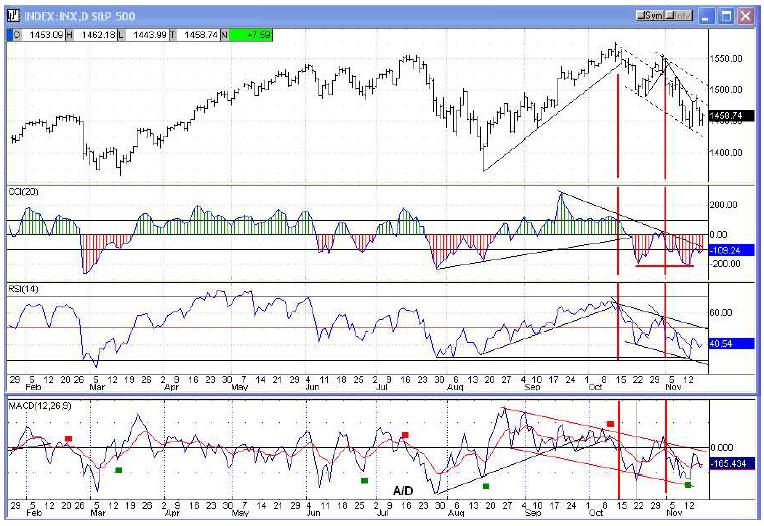
But the loss of downward momentum -- which is one of the best indications that a reversal is imminent -- shows up best in the next chart. It includes other versions of the momentum indicators, one of which (the CCI) is showing the strongest divergence.
The A/D oscillator, at the bottom, is also showing a most promising pattern of deceleration. It has been trending in a well-defined channel which would now require very little to be penetrated to the upside.
Cycles
Have we just experienced the traditional 7th year dip of the decennial pattern? If so, the stock market would have followed a strong historical precedent which normally ends with the 12-mo cycle making its low during the September to November time frame. Considering the positive divergence that is showing on the daily oscillators, there is a good chance that the SPX is near the end of its decline. But we must still deal with two more cycles which are directly ahead and may keep prices from moving up for a while longer, perhaps even causing lower lows as well. The 20-wk and the 9-mo cycles will bottom at about the same time -- in mid- December -- and could reinforce each other in a final spike down before the index can start a late year-end rally.
On the top chart, I have marked previous 20-wk and 9-mo cycles going back to August 2006. The green (non-Hurst) 9-mo cycle is a separate cycle from the black (Hurst) 9-mo cycle which is a subdivision of the 18- yr cycle. You can see that neither cycle has caused a sharp retracement going into its low in the past year and a half. The 20-week cycle has a mixed history, so we cannot predict how much of a pull-back we will get. It will probably depend on the amount of strength which precedes the cycle bottom.
The decline which started at 1492 is caused by at least one and possibly two short-term cycles, both of which are ideally scheduled to make their lows on Monday.
Breadth
As I mentioned with regards to the SPX chart above, the A/D MACD is now beginning to show a pattern of deceleration and divergence which implies that a short-term low could be imminent. But because of the cyclical pattern, there could be some additional basing until mid-December before a good rally can get under way. The McClellan Summation indices are still trending down, and will continue to do so until the McClellan oscillator turns positive once again.
Market Leaders & Sentiment
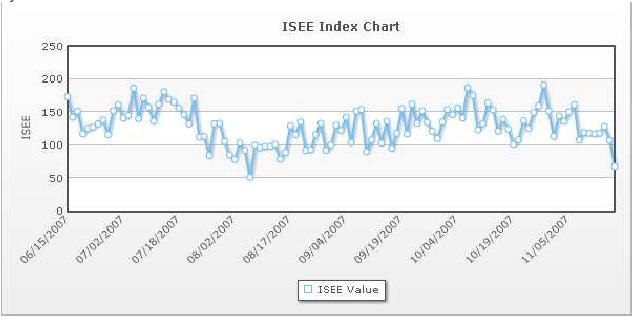
In the last newsletter, I mentioned that the QQQQ, although it was showing strong positive divergence to the SPX, had gotten ahead of itself and was coming up against some strong overhead resistance. Over the past two weeks, the index has made a fast and sharp correction which retraced a little more than .618% of its rise from 8/16. During this time, it led the SPX down. Now it looks as if it is just beginning to re-affirm its positive leadership over the SPX, and its longer-term positive divergence is still intact, although diminished. The ISEE (put/call index) is probably showing the best evidence that we are at or very near a short-term low. On Friday, it closed at its lowest level since its 8/10 low. That low was followed one week later by the 4.5-yr cycle low which took the SPX from 1371 to 1576.
Summary
The short-term technical condition of the market has improved as a result of positive divergence appearing in indicator patterns and a great improvement in sentiment. This normally suggests that an end to the decline is imminent, but there are two cycles due to make their lows in mid-December that could still delay the process and cause some additional consolidation .
The following are examples of unsolicited subscriber comments:
What is most impressive about your service is that you provide constant communication with your subscribers. I would highly recommend your service to traders. D.A.
Andre, You did it again! Like reading the book before watching the movie! B.F.
I would like to thank you so much for all your updates / newsletters. as i am mostly a short-term trader, your work has been so helpful to me as i know exactly when to get in and out of positions. i am so glad i decided to subscribe to turning points. that was one of the best things i did ! please rest assured i shall continue being with turning points for a long while to come. thanks once again ! D.P.
But don't take their word for it! Find out for yourself with a FREE 4-week trial. Send an email to ajg@cybertrails.com .
By Andre Gratian
MarketTurningPoints.com
A market advisory service should be evaluated on the basis of its forecasting accuracy and cost. At $25.00 per month, this service is probably the best all-around value. Two areas of analysis that are unmatched anywhere else -- cycles (from 2.5-wk to 18-years and longer) and accurate, coordinated Point & Figure and Fibonacci projections -- are combined with other methodologies to bring you weekly reports and frequent daily updates.
“By the Law of Periodical Repetition, everything which has happened once must happen again, and again, and again -- and not capriciously, but at regular periods, and each thing in its own period, not another’s, and each obeying its own law … The same Nature which delights in periodical repetition in the sky is the Nature which orders the affairs of the earth. Let us not underrate the value of that hint.” -- Mark Twain
You may also want to visit the Market Turning Points website to familiarize yourself with my philosophy and strategy.www.marketurningpoints.com
Disclaimer - The above comments about the financial markets are based purely on what I consider to be sound technical analysis principles uncompromised by fundamental considerations. They represent my own opinion and are not meant to be construed as trading or investment advice, but are offered as an analytical point of view which might be of interest to those who follow stock market cycles and technical analysis.
Andre Gratian Archive |
© 2005-2022 http://www.MarketOracle.co.uk - The Market Oracle is a FREE Daily Financial Markets Analysis & Forecasting online publication.