


Stock Market Bottoming Soon
Stock-Markets / Stock Markets 2011 May 29, 2011 - 03:37 AM GMTBy: Tony_Caldaro

 Another choppy week in the US stock market that led to the fourth consecutive, albeit small, weekly loss. On the economic front positive reports outpaced negatives 8:5. On the negative side: durable goods orders, pending homes sales, the M1-multiplier, and the WLEI declined; while weekly Jobless claims rose. On the positive side: we had increases in new homes sales, the FHFA housing index, PCE prices, the monetary base and consumer sentiment. Remaining positive were Q1 GDP and personal income/spending.
For the week the SPX/DOW were -0.40%, and the NDX/NAZ were -0.45%. Asian markets lost 1.6% and European markets lost 0.6%. The DJ World index, however, gained 0.2% and the Commodity equity group gained 2.0%. Bonds were +0.8%, Crude gained 1.2%, Gold gained 1.6%, and the USD lost 1.0%. Next week: Chicago PMI, ISM , the Payrolls report and Case-Shiller.
LONG TERM: bull market
When we review the monthly and weekly charts we see very few signs of a potential market top. We have, however, posted a very low probability SPX bull market top count on the NDX daily chart. Other than this potential count we see very few market internals supporting this view. Our weekly chart continues to look like a bull market is unfolding.
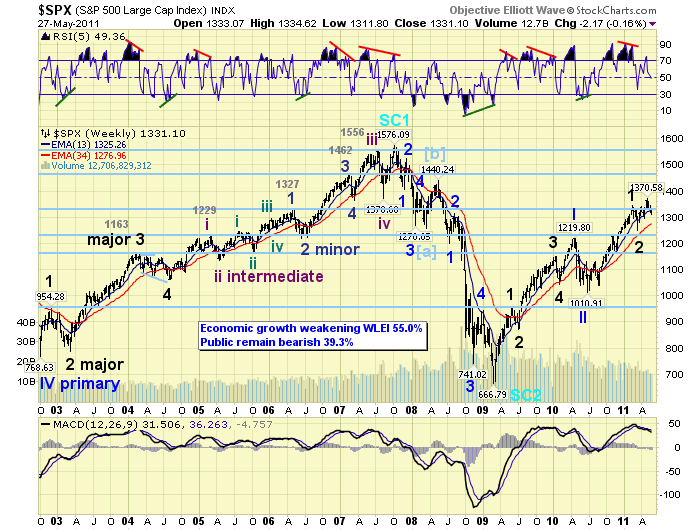
Notice during bull markets, 2002-2007 and 2009-now, the MACD remains above the neutral line and the RSI spends most of the time in overbought condition. Then during a bear market both of these indicators reverse. Also observe how the last bull market started off quite simple and then extended into a complex Major wave 5. We may be experiencing the early signs of a wave extension in our current market.
We have been expecting this bull market to unfold in five Primary waves. Primary I consisted of five Major waves, and Primary II was a somewhat complex correction. Primary wave III started off simple enough with Major waves 1 and 2. Now it appears we may be experiencing a subdivision for Major wave 3, or a continuation of Major wave 2 in the form of an irregular correction. Either way, it’s still a bull market.
MEDIUM TERM: downtrend likely underway
The uptrend started off simple enough from the SPX 1249 March low. A rally to SPX 1339, a pullback to 1295, then another rally to 1371. The monday SPX 1371 was hit was the first trading day after the news of Osama bin Laden’s death. That week the risk trade appeared to wind down as both Silver and Crude tumbled. The stock market also started to weaken with a drop to SPX 1329. For the rest of the month the SPX has been drifting lower in choppy action. The decline thus far has been 4.3% (SPX 1371 to 1312).
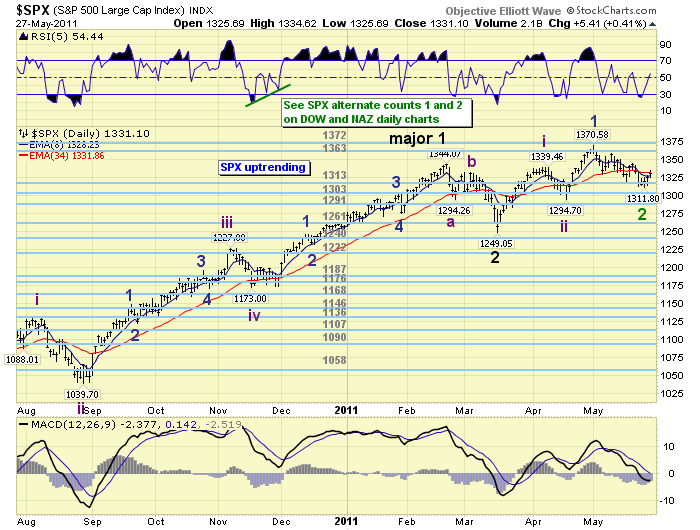
The internal count for the March-May uptrend offers three possibilities. We have been using the above count since the uptrend began in March. If the market can avoid a downtrend confirmation next week it is still the working count.
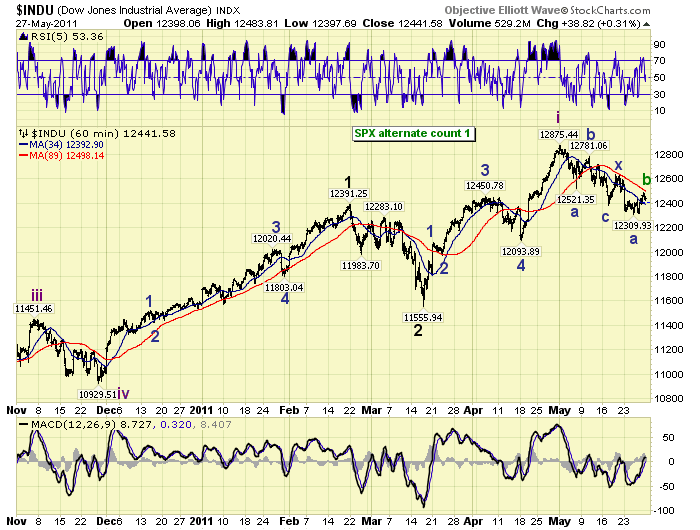
The second and higher probability count is a five wave structure, with a small second wave and much larger fourth wave, completing Intermediate wave one. This SPX count is displayed on the DOW hourly/daily charts.
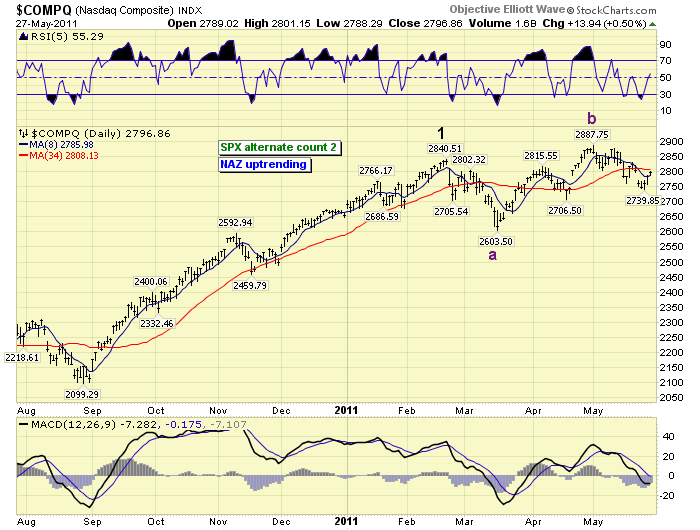
The third count suggests that the entire uptrend was a B wave of Major wave 2. And the C wave decline to end Major wave 2 is currently underway. This SPX alternate count is posted on the NAZ daily chart. Currently we prefer the five wave structure count, alternate #1.
SHORT TERM
Support for the SPX remains at 1313 and then 1303, with resistance at 1363 and then 1372. Short term momentum hit overbought during friday’s rally and ended around neutral. There is a high probability the SPX has been in a downtrend since the 1371 high. When the downtrend is confirmed we will switch the SPX internal count to alternate #1 posted on the DOW hourly/daily charts. The decline from the high appears to be unfolding in a double three.
The first decline was an ABC zigzag from SPX 1371 to 1319. Then we had a counter trend rally to SPX 1347. That was followed by a decline to SPX 1312 and a rally to 1335. We are counting this last activity as an A and B of the second ABC decline. We also note the first decline was 52 points (1371 to 1319). Should the second decline equal the first, and the SPX should bottom around 1295 = 1347 – 52.
After the first trading day of the month, the market has spent the rest of May trading between the 1313 and 1363 pivots. Naturally, a breakout to the upside would indicate the bull market is resuming, a breakdown the correction continues. Our short term count suggests there will be a retest of the 1313 pivot, plus the 1303 and 1291 pivots as well. Should the OEW 1291 pivot fail, then the SPX alternate #2 count would come into play. Best to your trading!
FOREIGN MARKETS
Asian markets were all lower on the week for net loss of 1.6%. China’s SSEC dropped 5.2% and all five indices are in confirmed downtrends.
European markets were mostly lower for a net loss of 0.6%. Three of the five indices we track are in downtrends.
The Commodity equity group were all higher on the week gaining 2.0%. All three are still in downtrends, but improving.
The downtrending DJ World index gained 0.2% on the week.
COMMODITIES
Bond prices continue to uptrend, +0.8% for the week, and rates downtrend. The 1YR is yielding 0.18%, suggesting no chance of a FED rate increase in the foreseeable future.
Crude is downtrending but gained 1.2% on the week. This looks like a B wave rally with $105, more or less, the upper limit. Support is between $85 and $93.
Gold, (+1.6%), is likely to confirm a downtrend soon, joining Silver and Platinum. It held support quite well during the selloff in commodities. Yet, it has been unable to generate the upside momentum needed to resume the uptrend.
The uptrending USD lost 1.0% on the week. We have resistance between 77 and 79 DXY.
NEXT WEEK
With monday a holiday in the States economic reports start rolling in on tuesday. At 9:00 tuesday the Case-Shiller housing index, at 9:45 the Chicago PMI and then at 10:00 Consumer confidence. On wednesday we have the ADP index, ISM manufacturing, Construction spending and Auto sales. Thursday, the weekly Jobless claims, Q1 Productivity and Factory orders. The Payrolls report on friday, with the Unemployment rate and ISM services. The FED is a bit active with Congressional testimony from FED general counsel Alvarez on wednesday, and a speech from FED governor Tarullo on friday. Best to you and yours this holiday weekend and week!
CHARTS: http://stockcharts.com/...
http://caldaroew.spaces.live.com
After about 40 years of investing in the markets one learns that the markets are constantly changing, not only in price, but in what drives the markets. In the 1960s, the Nifty Fifty were the leaders of the stock market. In the 1970s, stock selection using Technical Analysis was important, as the market stayed with a trading range for the entire decade. In the 1980s, the market finally broke out of it doldrums, as the DOW broke through 1100 in 1982, and launched the greatest bull market on record.
Sharing is an important aspect of a life. Over 100 people have joined our group, from all walks of life, covering twenty three countries across the globe. It's been the most fun I have ever had in the market. Sharing uncommon knowledge, with investors. In hope of aiding them in finding their financial independence.
Copyright © 2011 Tony Caldaro - All Rights Reserved Disclaimer: The above is a matter of opinion provided for general information purposes only and is not intended as investment advice. Information and analysis above are derived from sources and utilising methods believed to be reliable, but we cannot accept responsibility for any losses you may incur as a result of this analysis. Individuals should consult with their personal financial advisors.
© 2005-2022 http://www.MarketOracle.co.uk - The Market Oracle is a FREE Daily Financial Markets Analysis & Forecasting online publication.