


SPX Stock Market Index Elliott Wave Pattern Analysis
Stock-Markets / Stock Markets 2011 Jun 09, 2011 - 08:35 AM GMTBy: Tony_Caldaro

We took a close look at the SPX charts in response to recent developments in the market. After a review of the SPX, on various timeframes, one count appeared as the most probable for this correction. We just posted that count on the SPX hourly chart.
After the SPX 1371 uptrend high we have had four declines and three intervening rallies. The largest of these three rallies occurred after the market found support at SPX 1312 on May 25th. During corrections this usually means that an A wave was completed and a B wave unfolded. Heading into that SPX 1312 low the market had been quite choppy with a general drfit downwards. This is usually indicative of a complex wave which sometimes forms a wedge. A declining wedge does appear to have formed to complete a Minor A wave. Then the rally from SPX 1312 to 1345 completed a Minor B wave. This last decline is more impulsive as it forms a Minor C wave which will complete the zigzag.
When we review the Feb11 SPX 1344 to Mar11 SPX 1249 correction we find it also unfolded in a zigzag: Minor A SPX 1249, Minor B SPX 1332 and Minor C SPX 1249. Observe that Minor wave C was 1.618 times Minor wave A (83 points vs 50 points).
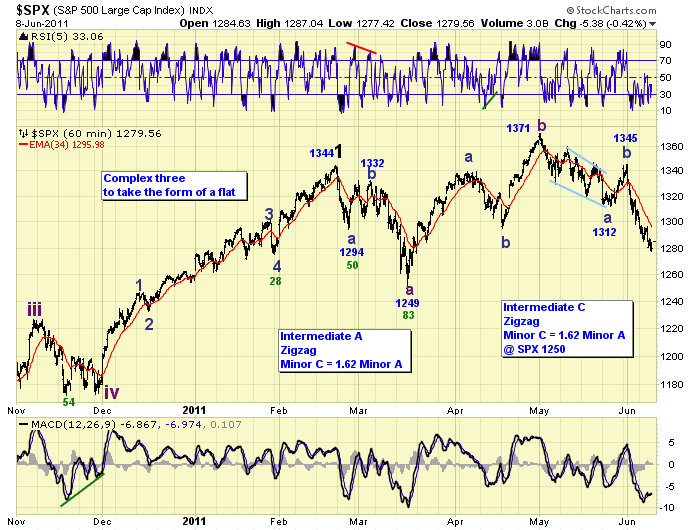
Reviewing the entire pattern we see an Minor wave ABC downtrend from Feb11 to Mar11 (SPX 1344 to 1249), a Minor wave ABC uptrend from Mar11 to May11 (SPX 1249 to 1371), then another Minor wave ABC downtrend from May 11 (SPX 1371). This suggests this market has been in an irregular complex correction since the Feb11 SPX 1344 high. These three waves will complete Intermediate waves ABC of a Major wave 2 correction. Longer term irregular corrections are quite bullish. The DOW experienced several of them during the 2002-2007 bull market before it took off in 2006-2007 (DOW 10K to 14K).
When we count the current downtrend, as noted on the SPX hourly chart, we observe Minor wave A declined 59 points (1371 – 1312). Then a Minor B wave rally to SPX 1345. If this Minor C wave decline is also 1.618 times Minor A, like the Minor waves during the Feb11-Mar 11 downtrend noted above, then we can expect a low around SPX 1250. This entire pattern would then have created a complex irregular double three in the form of a flat. SPX 1250 falls within the OEW 1240 and 1261 pivots. Therefore we would expect Major wave 2 support in the OEW 1240 pivot range.
Longer term this count does not change the bullish picture. The market just appears to have delayed its rise while it consolidates. We’re still expecting a retest of the all time high near SPX 1576 in 2012. Best to your trading!
CHARTS: http://stockcharts.com/...
http://caldaroew.spaces.live.com
After about 40 years of investing in the markets one learns that the markets are constantly changing, not only in price, but in what drives the markets. In the 1960s, the Nifty Fifty were the leaders of the stock market. In the 1970s, stock selection using Technical Analysis was important, as the market stayed with a trading range for the entire decade. In the 1980s, the market finally broke out of it doldrums, as the DOW broke through 1100 in 1982, and launched the greatest bull market on record.
Sharing is an important aspect of a life. Over 100 people have joined our group, from all walks of life, covering twenty three countries across the globe. It's been the most fun I have ever had in the market. Sharing uncommon knowledge, with investors. In hope of aiding them in finding their financial independence.
Copyright © 2011 Tony Caldaro - All Rights Reserved Disclaimer: The above is a matter of opinion provided for general information purposes only and is not intended as investment advice. Information and analysis above are derived from sources and utilising methods believed to be reliable, but we cannot accept responsibility for any losses you may incur as a result of this analysis. Individuals should consult with their personal financial advisors.
© 2005-2022 http://www.MarketOracle.co.uk - The Market Oracle is a FREE Daily Financial Markets Analysis & Forecasting online publication.