


Stock Market Choice Between Bulls Buying or Waterfall Drop
Stock-Markets / Stock Markets 2011 Jun 12, 2011 - 09:27 AM GMT

 It appears that the markets are now moving into areas where the bulls need to decide if they want to hold this market and step up to the table to buy it, or leave well alone and then could potentially see a waterfall from these levels.
The market is very oversold, there is no question about that, but the big moves come from oversold conditions, with the market now reversing from the lack of support from the POMO and QE operations, it's clear that the stock market rallying for the past 2 years has been one big shell game, and unless the FED comes into support the markets via another round of POMO and QE3, then further prices are likely, just like we saw in 2010 as QE1 ended and a near 20% correction until word of QE2.
We are now down to 3 set ups, although with the weakness seen in the markets, the triangle idea is looking very weak, we are already seeing potential evidence in other markets or set ups that could trigger far lower prices, and going into next week, we are watching our key resistance areas for any violation on the markets we follow, as long as they are not exceeded we are still net sellers of these markets and have been for weeks.
It's important to note that the decline is still only 3 waves, but we are at areas where clues to price action will confirm or negate one of these patterns.
The chainsaw catchers, have been burnt a few times trying to catch a low, if you have watched the markets for a long time, you get to feel of its pulse, and the rallies have been in 3 waves and approx 10 handles on the bounces, those are classic corrections in a down trend, and we relish those setups to sell, they are bread and butter trades and setups we at WPT enjoy trading, those are virtual "give me's"
Regardless of any idea, price always rule 1st, we follow what price is doing 1st and patterns second, as long as we see bounces in 10 handles and in 3 waves, we will continue to sell this market. We know what we are looking for to suggest a reversal, and only one occasion in the past 3 weeks, which was this week, do we think a potential low could have been put in place for wave [c] of the triangle idea, but Friday saw that idea busted and under our support areas, and we knew that we needed to be sellers again.
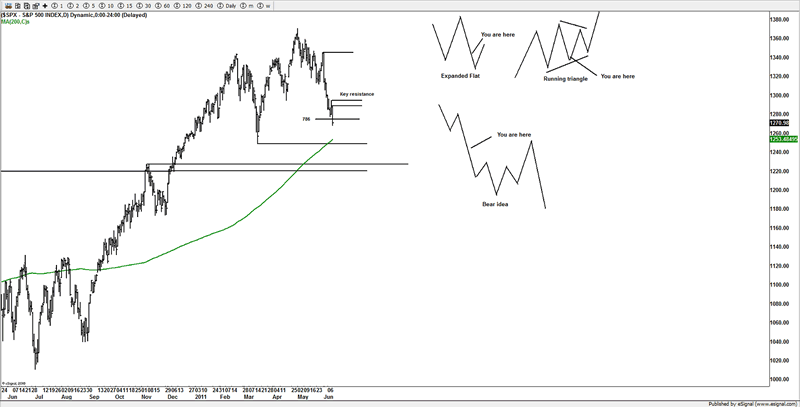
If a triangle and wave [c], then we should be near to a reversal, with the 200DMA virtually touched in markets such as the NDX and COMQ, the market might dip to around the 200DMA in the US markets and find some support, it's the strength from that bounce we are interested in, so far the level of buying has been extremely weak, oversold conditions can yield some huge moves to the downside, its where crashes can come from, whilst we are not particularly looking for a crash, as long as our resistance areas are not violated then we continue to remain short and net sellers, we are not interested in the long side yet, until we see evidence of a potential low in place, we will leave the bottom calling for other traders, we just stick with what works to make solid trades.
If you have noticed price action on bearish trends, they see a lift from around midday into around 3pm and sell off into the close, that's a bearish signature and we have seen it a few times in the past 2 weeks, the locals are lifting the markets to look for weak buy stops and sellers are dumping into the last 60/30 mins, those are some of the easiest trades you will ever get to trade and we have been patiently waiting for those to setup, 10 handle bounces in 3 waves are a sell.
200DMA
As you can see a few markets are virtually at or just above the 200DMA, so a bounce probably will be seen, so early into next week, we might see some weakness and a bounce if the markets hit their respective 200DMA, but that area is a key moving average and one that big fund managers will probably put money to work from and an area of interest for us, of course the market needs to actually bounce and confirm clues to a potential low, but until it does we are not going to speculate to a low until price evidence suggests it.
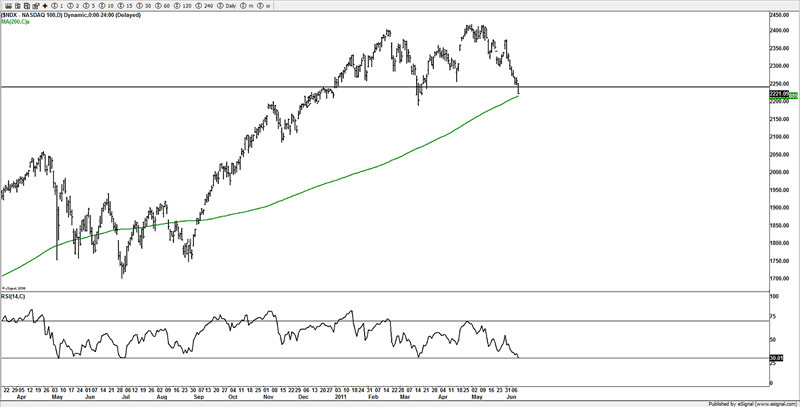
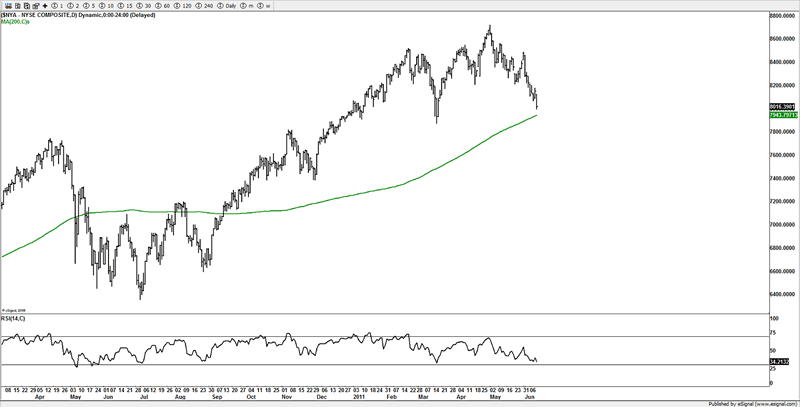
Also we noticed that the RSI on the daily time frame is nearing the 30 area, which is consider oversold on the daily time frame, so another area that potentially might be signally some sort of bounce could be triggered, there is no guarantee that we will see a bounce, but the move has been a great move on the short side, and the bears need to be a little cautious now as we are heading into those support areas, but we also are aware that any bounce needs to have some power behind it and be an obvious move that triggers or at least suggests a temporary change of trade or even an important low based on the patterns we are following.
Some great opportunities should be setting up over the coming few weeks and this is where you need to be on your game. As the potential to make some serious $$$ for traders that are focused is setting up.
Oil
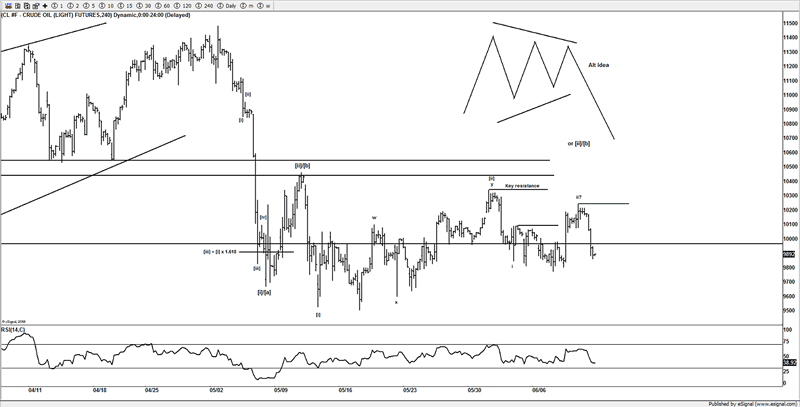
One market that some members have interest in is oil, and it's been in a sideways set for a few weeks after it crashed and burned from its yearly highs, we don't see price action yet to support a bullish case, and we still think there is further price falls coming, as the sideways pattern is suggesting lull before the next move down.
If we are correct about the next move lower we could see a move towards out initial target of $85, it will need a strong move $105-106, to suggest something is wrong with the idea of looking lower towards $85.
Bonds
A clue to stocks reversing or not, might be coming from the fact that bonds are now into resistance areas and appear to be tracing out a 3 wave move, so far towards a 50% retrace of the prior 5 wave decline, if traders move out of bonds into stocks that's potentially the fuel to push stocks higher, so another market to watch to see if we see money move out of bonds and back into stocks, again nothing is certain, but stocks to reverse I suspect will see bonds reversal low as money shifts out on the 10yr and 30yr paper into stocks. If you look closer there appear to be a small ED that could also be signally a reversal. So it's something that traders do need to keep a watchful eye.
The bad side is if bonds sell off as well as stocks, then you really have some issues in the US and that's a rare forced liquidation event, and only seen for a short time in the crash of 2008, bonds moving higher and stocks move lower is the normal relationship, likewise stock moving higher and bonds moving lower. The market is wrestling with its 200DMA, I find it ironic that bonds are flirting with its 200DMA as the US stocks markets are near their respective 200DMAs.
If you’re looking to follow these markets and many others that we follow, then take advantage of the 4 week free trial, where you can then evaluate the site and see it fits in with your trading style.
Click here to become a member
You can also follow us on twitter
What do we offer?
Short and long term analysis on US and European markets, various major FX pairs, commodities from Gold and silver to markets like natural gas.
Daily analysis on where I think the market is going with key support and resistance areas, we move and adjust as the market adjusts.
A chat room where members can discuss ideas with me or other members.
Members get to know who is moving the markets in the S&P pits*
*I have permission to post comments from the audio I hear from the S&P pits.
If you looking for quality analysis from someone that actually looks at multiple charts and works hard at providing members information to stay on the right side of the trends and making $$$, why not give the site a trial.
If any of the readers want to see this article in a PDF format.
Please send an e-mail to Enquires@wavepatterntraders.com
Please put in the header PDF, or make it known that you want to be added to the mailing list for any future articles.
Or if you have any questions about becoming a member, please use the email address above.
If you like what you see, or want to see more of my work, then please sign up for the 4 week trial.
This article is just a small portion of the markets I follow.
I cover many markets, from FX to US equities, right the way through to commodities.
If I have the data I am more than willing to offer requests to members.
Currently new members can sign up for a 4 week free trial to test drive the site, and see if my work can help in your trading and if it meets your requirements.
If you don't like what you see, then drop me an email within the 1st 4 weeks from when you join, and ask for a no questions refund.
You simply have nothing to lose.
By Jason Soni AKA Nouf
© 2011 Copyright Jason Soni AKA Nouf - All Rights Reserved
Disclaimer: The above is a matter of opinion provided for general information purposes only and is not intended as investment advice. Information and analysis above are derived from sources and utilising methods believed to be reliable, but we cannot accept responsibility for any losses you may incur as a result of this analysis. Individuals should consult with their personal financial advisors.
© 2005-2022 http://www.MarketOracle.co.uk - The Market Oracle is a FREE Daily Financial Markets Analysis & Forecasting online publication.